A Looming Climate Shift: Will Ocean Heat Come Back to Haunt us?

By Rob Painting / SkepticalScience, June 24, 2013:
Key Points:
- Despite a large increase in heat being absorbed by the Earth’s climate system(oceans, land & ice), the first decade of the 21st century saw a slowdown in the rate of global surface warming (surface air temperatures).
- A climate model-based study, Meehl (2011), predicted that this was largely due to anomalous heat removed from the surface ocean and instead transported down into the deep ocean. This anomalous deep ocean warming was later confirmed by observations.
- This deep ocean warming in the model occurred during negative phases of theInterdecadal Pacific Oscillation (IPO), an index of the mean state of the north and south Pacific Ocean, and was most likely in response to intensification of the wind-driven ocean circulation.
- Meehl (2013) is an update to their previous work, and the authors show that accelerated warming decades are associated with the positive phase of the IPO. This is a result of a weaker wind-driven ocean circulation, when a large decrease in heat transported to the deep ocean allows the surface ocean to warm quickly, and this in turn raises global surface temperatures.
- This modelling work, combined with current understanding of the wind-driven ocean circulation, implies that global surface temperaures will rise quickly when the IPO switches from the current negative phase to a positive phase.
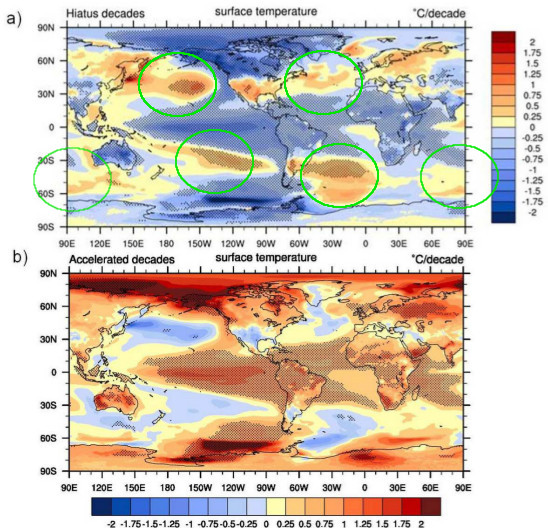
Figure 1 – average sea surface temperature trends from the climate model simulations for a) ‘hiatus’ decades, i.e. decades with no warming of global mean surface temperatures, and b) ‘accelerated’ decades, i.e. decades with greater-than-average rises in global surface temperatures. The subtropical ocean gyres (green ellipses) are key players in the downward transport of heat. The stippling indicates areas where this trend is statistically significant. From Meehl (2013)
Even with Global Dimming, Still Lots of Warming Down Below
The way that global warming has progressed in the 21st century has probably been a great surprise to many people, no doubt a few climate scientists among them. Despite a strong increase in planet-warming greenhouse gas emissions, warming of global surface temperatures has been rather muted. Surface temperatures have warmed, but at a slower rate than the last two decades of the 20th century.
Of course, the 2000’s doesn’t strictly qualify as a hiatus decade as defined in Meehl (2013) – where hiatus decades are described as negative global surface temperaturetrends – but it is, nevertheless, a suitable analogue.
Increases in sunlight-blocking sulfate pollution (from industrial activity) during the early part of the 21st century have probably played a role (Hatzianasstissiou [2011]), as have sulfate emissions from tropical volcanoes (Solomon [2011], Vernier [2011]), but the most significant contributor to this muted surface warming trend are natural changes in the way heat is stored in the ocean.When large amounts of heat are efficiently transported to the deep ocean (as in the 2000’s – see Levitus [2012], Nuccitelli [2012] & Balmaseda [2013]), there is less heat available at the ocean surface with which to raise global surface temperature.
This can be better understood by considering the effects of the El Niño-Southern Oscillation (ENSO) on the vertical distribution of heat in the surface layers of the ocean. During El Niño heat builds up in the surface layers where it is able to interact with the atmosphere, and therefore raises global surfaces temperatures. During La Niña much more heat is transported to deeper ocean layers and, with the surface layers cooler-than-normal, global surface temperatures are cooler-than-average. This can be seen in Figure 2 – using observations from the global system of ARGO floats.
Figure 2 – Time?series of globally-averaged (60°South to 60°North) ocean temperature anomaly from the monthly mean, versus depth in metres (pressure in dbar).(b) Time?series of globally-averaged sea surface temperature anomaly (black, °C), ocean temperature at 160 metre depth (blue), and the Nino3.4 regression estimate for SST (red). From Roemmich & Gilson (2011).
The Interdecadal Pacific Oscillation (Power [1999]) is an index for the mean state of the north and south Pacific Oceans. During the positive phase, El Niño is the dominant global weather pattern, and during the negative phase, La Niña is dominant. During the late 1990’s the positive IPO phase weakened considerably and has been in the negative phase since the year 2000. In other words, La Niña been the dominant pattern of late. It is therefore not surprising that global surface temperatures during the 2000’s have warmed less than previous decades (1977-2000) – when the IPO was in a positive (El Niño-dominant) state.
Some Background Context
Present warming of the global oceans is a result of increased atmospheric concentrations of greenhouse gases warming the thin cool-skin layer at the sea surface. This reduces the typical rate of heat loss from the ocean to the atmosphere above, and therefore causes the oceans to grow warmer over time. So much like greenhouse gases trap heat in the atmosphere, by reducing the rate of heat loss to space, they also reduce the rate of heat loss from the ocean too. While changes in the ocean circulation brought on by warming can, and probably do, contribute to overall uptake of heat by the ocean, this greenhouse gas-induced warming of the surface ocean is the dominant player over the long-term.
Though not strictly true, it’s easier to think of the ocean circulation as two distinct but interconnected processes – the wind-driven ocean circulation which warms and ventilates (mixes air into) the surface-to-deep ocean (down to about 2000 metres), and thethermohaline circulation which warms and ventilates the deep-to-abyssal ocean (2000 mtrs to ocean floor), and which is mainly driven by changes in the bouyancy and density of seawater. The wind-driven ocean circulation can be described as a pool of warm salty surface ocean sitting on top of a cold fresh (less salty) abyssal ocean.
The transport of heat down into the surface to deep ocean occurs via the subtropical ocean gyres (green ellipses in Figure 1). These are large rotating masses of water, in each ocean basin, where ocean currents converge at their centre and are forced downwards, taking warm surface water with them. Future SkS posts will deal with the ocean gyres and how they operate, but note that changes in the winds which power the ocean gyres affect the transport of heat down into the ocean, and also the transport of heat from the tropics to the polar regions. Intensified tropical easterly trades winds, for instance, spin up the ocean gyres leading to greater downward, and poleward, heat transport (see Roemmich [2007]).
Accelerated Warming and Hiatus Decades
Meehl (2013) once again uses the NCAR CCSM4 climate model to evaluate decadal periods of either accelerated warming, or slight cooling (hiatus decades). To accomplish this the authors use a moderate future (fossil fuel) emissions scenario for the 21st century combined with historical simulations of the 20th century. This future emissionsscenario is chosen because the climate forcing is not so strong that hiatus decades disappear entirely in the latter part of the 21st century simulations.
From five climate model runs of the 21st century the authors derive 500 years worth of simulations. The hiatus decades were chosen based on a slight cooling trend in global surface temperatures of less than -0.08°C per decade. Eight decades match this criteria and the composite of their surface temperature trends are shown in Figure 1(a). If a zero decade-long temperature trend were chosen as well, then there are many more decades that fall under that criteria, including three instances where no warming lasts for 14 years, and one where this persists for 15 years.
For the accelerated warming decades the authors choose decades where the global surface warming is at least 0.41°C per decade (around twice the observed warming over the last few decades based on GISTEMP). Like the hiatus decades, these large values for the accelerated warming decades were chosen so that the trends were obvious. The composite of the trends for these accelerated decades are shown in Figure 1(b).
It is apparent in Figure 1, that the hiatus and accelerated warming decades are virtually the mirror image of each other. The warm sea surface temperatures in the gyres, during hiatus decades, indicate convergence of near-surface currents and strong downwelling of heat. With accelerated decades the vertical, and poleward, transport of heat by the gyres seems to shutdown, enabling strong sea surface warming in the tropics – where mostsolar radiation enters the ocean. The strong warming in the polar regions is related to changes in the thermohaline circulation.
A comparison of the accelerated warming and hiatus with regard to all the other decades in the simulations is shown in Figure 3. Obvious is the tendency for warming of the deeper ocean layers during hiatus decades, and warming of the surface ocean layer (0-300m) during accelerated warming decades.
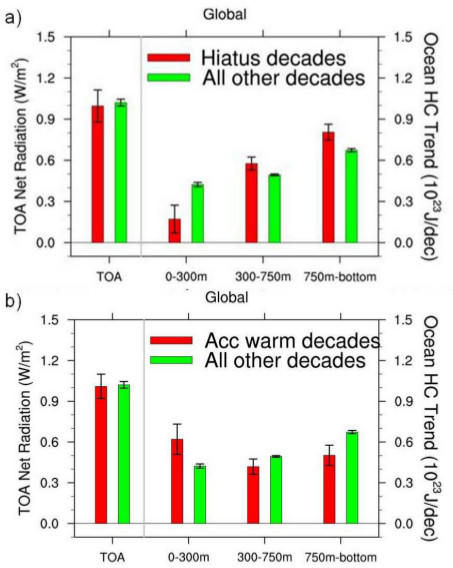
Figure 3(a) – average linear trends for hiatus decades versus trends for all other decades, broken down into 3 ocean layers. The top-of-the-atmosphere radiation balance (left-hand columns) is strongly positive, indicating a strong global warming trend. The error bars denote 5% statistical significance. 3(b) – same as above except for accelerated warming decades. From Meehl (2013).
Although I have not delved into it here (to keep things less complicated), changes to the thermohaline circulation, specifically the Atlantic Meridional Overturning Circulation(AMOC) and Antarctic Bottom Water (AABW) formation, also play a part in the hiatus and accelerated warming decades in the climate model. The thermohaline changes associated with the IPO suggest a common mechanism at work – most likely the changes in wind forcing. All three processes (IPO, AMOC & AABW) are contributors in each hiatus and accelerated decades, but the authors analysis reveals the IPO to play the dominant role.

Ocean Heat Content
A Looming Climate Shift
During the late 1970’s global surface temperatures changed so quickly (Graham [1995]) that some researchers labelled this a ‘climate shift’ (Miller [1994], Wainwright [2008]). It was later shown that this climate shift was simply the human-caused global warming trendcombining with the positive (warm surface ocean) phase of the Interdecadal Pacific Oscillation (Meehl [2009]). With both driving forces moving in same (warming) direction, they combined to nudge global surface temperatures sharply upwards.
The late 1970’s climate shift is an appropriate analogue for the near-future because, based on the modelling in Meehl (2013) and other peer-reviewed scientific papers not discusssed here, the current negative IPO (cool surface ocean-warm deep ocean) trend is likely to come to an end sometime soon. The NCAR climate model suggests that these phases can last up to 15 years, but are generally around a decade in length. This climate model-based IPO cycle length is shorter than the IPO cycle length observed during the 20th century, however the reasons for this disparity are not yet clear.
Whenever this phase reversal does kick in there are likely to be significant changes in global rainfall patterns (Dai [2012]), drought, mass coral bleaching and fish catches (caused by change in the wind-driven upwelling of nutrients in key areas of the ocean). Just how significant this is will depend on how much heat remains in the surface ocean during the next positive phase of the IPO.
So to answer the question posed in the title – will ocean heat come back to come to haunt us? Yes, but perhaps not in the way some might think. Heat buried in the deep layers of the ocean will not re-surface any time soon. Instead, when the subtropical ocean gyres spin down, they will no longer be efficiently removing heat from the tropical surface ocean. The transport of ocean heat to depths, and to the poles, will drastically slow down, and this will allow the surface of the tropical oceans to warm rapidly. That heat is very likely to haunt us.
Feature image via SkepticalScience “Where is Global Warming Going”?
Related
Support Earth Climate

About the Author: EARTH CLIMATE
Support
We create visually compelling, accessible science content that transforms complex research into engaging videos and articles, helping millions understand the discoveries shaping our world. Paypal Donations | Patreon
With an El Nino event forecast the heat may be coming back out of the oceans soon. http://www.climateoutcome.kiwi.nz/blog.html