Ocean Acidification Summary for Policymakers 2013

Published by IGBP November 14, 2013This summary for policymakers reports […]

Post Author:

Climate State

Date Posted:

December 30, 2013

Published by IGBP November 14, 2013
This summary for policymakers reports on the state of scientific knowledge on ocean acidification, based on the latest research presented at The Third Symposium on the Ocean in a High-CO2 World, held in Monterey, California, in September 2012. Experts present the projected changes from ocean acidification for ecosystems and the people who rely on them, according to levels of confidence for these outcomes.

Ocean Acidification Summary for Policymakers
Third Symposium on the Ocean in a High-CO2 World
Download the full pdf  (pdf, 4.9 MB)
High resolution A3-size jpg of pH infographic (4.9mb)
High resolution A3-size jpg of aragonite infographic (4.7mb)

Release URL

Download the summary here, as well as the infographics that illustrate the problems that ecosystems and humans face as ocean acidification increases over the next century. The summary addresses outcomes based on whether humans continue to emit carbon dioxide at current rates to the atmosphere, or what could happen if policymakers take action to mitigate these emissions.
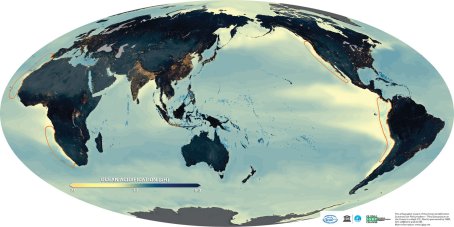
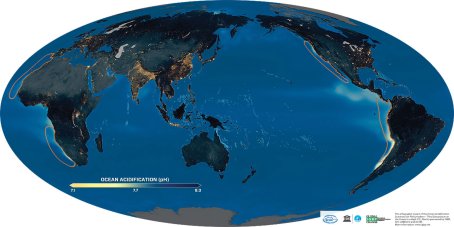
The average pH of ocean surface waters has fallen by about 0.1 units, from 8.2 to 8.1, since the beginning of the industrial revolution. This corresponds to a 26% increase in acidity. Please see original infographic for sources and further information.
Compared with preindustrial levels shown here, the projected increase in ocean acidity is about 170% by 2100 if high CO2 emissions continue (RCP* 8.5).
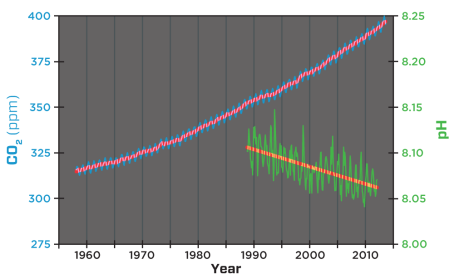
Observations of CO2 (parts per million) in the atmosphere and pH of surface seawater from Mauna Loa and Hawaii Ocean Time-series (HOT) Station Aloha, Hawaii, North Pacific. Credit: Adapted from Richard Feely (NOAA), Pieter Tans, NOAA/ESRL (www.esrl.noaa.gov/gmd/ccgg/trends) and Ralph Keeling, Scripps Institution of Oceanography (scrippsco2.ucsd.edu)
Observations of CO2 (parts per million) in the atmosphere and pH of surface seawater from Mauna Loa and Hawaii Ocean Time-series (HOT) Station Aloha, Hawaii, North Pacific.
Credit: Adapted from Richard Feely (NOAA), Pieter Tans, NOAA/ESRL (www.esrl.noaa.gov/gmd/ccgg/trends) and Ralph Keeling, Scripps Institution of Oceanography (scrippsco2.ucsd.edu)
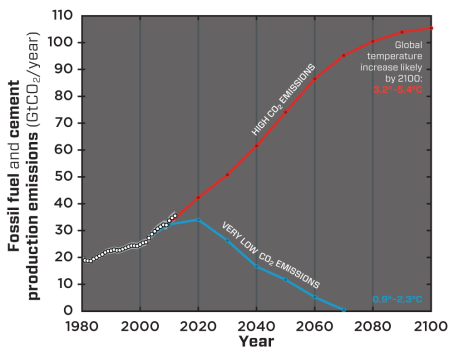
Global CO2 emissions (white dots, uncertainty in grey) from fossil fuel use is following the high emissions trajectory (red line, RCP* 8.5) predicted to lead to a significantly warmer world. Large and sustained emissions reductions (blue line, RCP* 2.6) are required to increase the likelihood of remaining within the internationally agreed policy target of 2°C.  Credit: Glen Peters and Robbie Andrew (CICERO) and the Global Carbon Project, adapted from Peters et al., 2013 (reference 8). Historic data from Carbon Dioxide Information Analysis Center.
Global CO2 emissions (white dots, uncertainty in grey) from fossil fuel use is following the high emissions trajectory (red line, RCP* 8.5) predicted to lead to a significantly warmer world. Large and sustained emissions reductions (blue line, RCP* 2.6) are required to increase the likelihood of remaining within the internationally agreed policy target of 2°C.
Credit: Glen Peters and Robbie Andrew (CICERO) and the Global Carbon Project, adapted from Peters et al., 2013 (reference 8). Historic data from Carbon Dioxide Information Analysis Center.
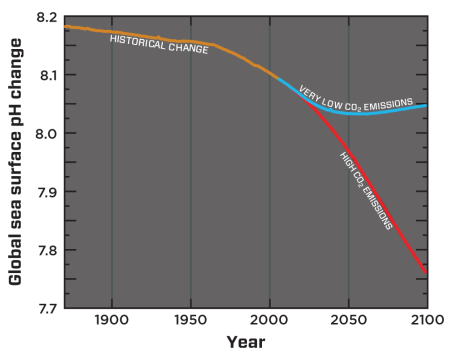
Modelled global sea-surface pH from 1870 to 2100. The blue line reflects estimated pH change resulting from very low CO2 emissions to the atmosphere (IPCC Representative Concentration Pathway, RCP* 2.6). The red line reflects pH from high CO2 emissions (the current emissions trajectory, RCP* 8.5). Credit: Adapted from Bopp et al., 2013 (reference 9).
Modelled global sea-surface pH from 1870 to 2100. The blue line reflects estimated pH change resulting from very low CO2 emissions to the atmosphere (IPCC Representative Concentration Pathway, RCP* 2.6). The red line reflects pH from high CO2 emissions (the current emissions trajectory, RCP* 8.5).
Credit: Adapted from Bopp et al., 2013 (reference 9).
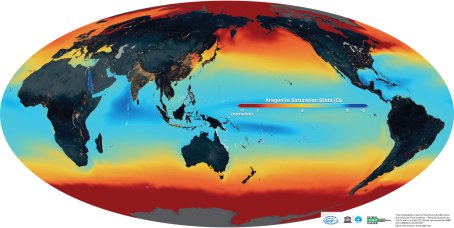
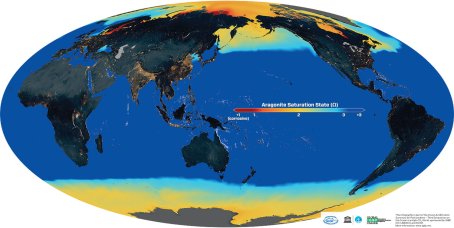
This map shows the “saturation state” for the mineral form of calcium carbonate called aragonite. If Ω is less than 1 (Ω<1), conditions are corrosive (undersaturated) for aragonite-based shells and skeletons. Coral growth benefits from Ω≥3. By 2100, computer model projections show that Ω will be less than 3 in surface waters around tropical reefs if CO2 emissions continue on the current trajectory.
This map shows the “saturation state” for the mineral form of calcium carbonate called aragonite.
If Ω is less than 1 (Ω<1), conditions are corrosive (undersaturated) for aragonite-based shells and skeletons. Coral growth benefits from Ω≥3.
By 2100, computer model projections show that Ω will be less than 3 in surface waters around tropical reefs if CO2 emissions continue on the current trajectory.
Aragonite saturation for surface ocean waters, at the beginning of the industrial revolution.

Related

Multiple stressors of ocean ecosystems in the 21st century: projections with CMIP5 models

doi:10.5194/bgd-10-3627-2013 | Release URL

Abstract

Ocean ecosystems are increasingly stressed by human-induced changes of their physical, chemical and biological environment. Among these changes, warming, acidification, deoxygenation and changes in primary productivity by marine phytoplankton can be considered as four of the major stressors of open ocean ecosystems. Due to rising atmospheric CO2 in the coming decades, these changes will be amplified. Here, we use the most recent simulations performed in the framework of the Coupled Model Intercomparison Project 5 to assess how these stressors may evolve over the course of the 21st century. The 10 Earth System Models used here project similar trends in ocean warming, acidification, deoxygenation and reduced primary productivity for each of the IPCC’s representative concentration parthways (RCP) over the 21st century. For the “business-as-usual” scenario RCP8.5, the model-mean changes in 2090s (compared to 1990s) for sea surface temperature, sea surface pH, global O2 content and integrated primary productivity amount to +2.73 °C, −0.33 pH unit, −3.45% and −8.6%, respectively. For the high mitigation scenario RCP2.6, corresponding changes are +0.71 °C, −0.07 pH unit, −1.81% and −2.0% respectively, illustrating the effectiveness of extreme mitigation strategies. Although these stressors operate globally, they display distinct regional patterns. Large decreases in O2 and in pH are simulated in global ocean intermediate and mode waters, whereas large reductions in primary production are simulated in the tropics and in the North Atlantic. Although temperature and pH projections are robust across models, the same does not hold for projections of sub-surface O2 concentrations in the tropics and global and regional changes in net primary productivity.

About the Author: Climate State

Profile photo ofadmin
Climate State covers the broad spectrum of climate change, and the solutions, since around 2011 with the focus on the sciences. Views expressed on this site or on social media are not necessarily the views by Climate State – we endorse data, facts, empirical evidence.

The Climate State Newsletter