Report: Europe warming twice as fast compared to rest of world
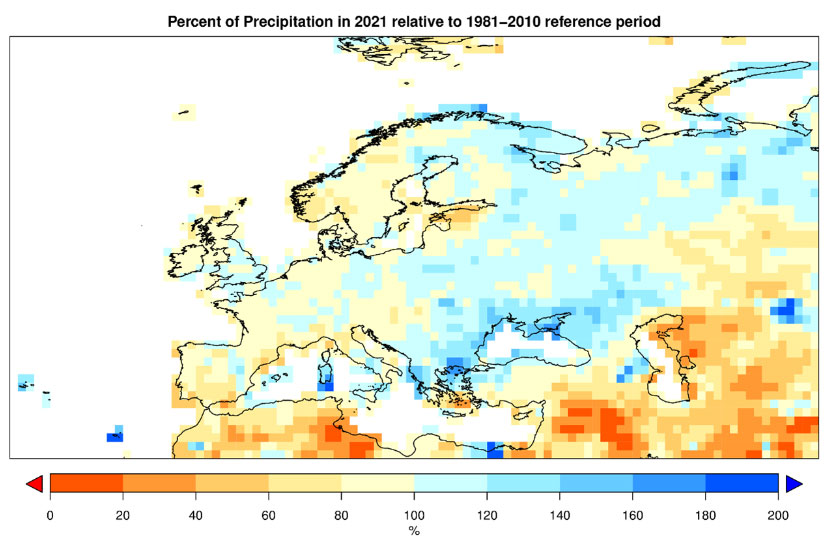
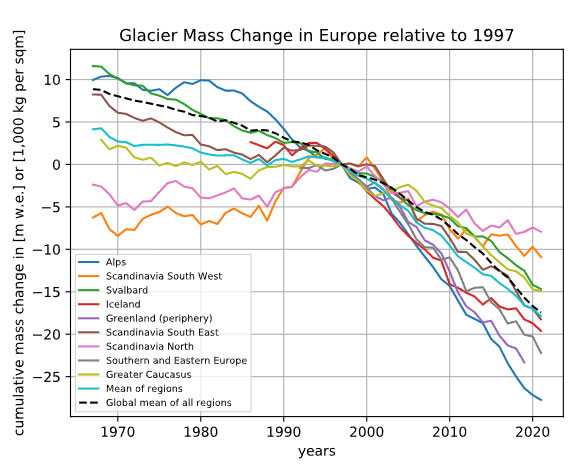
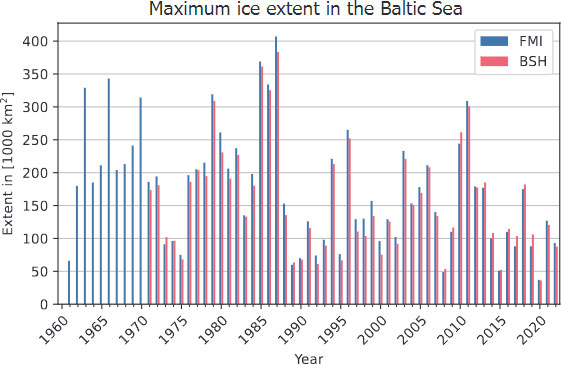
The World Meteorological Organization (WMO) published their annual climate report.
The report conclusions include:
- Temperatures in Europe have warmed significantly over the 1991–2021 period, at an average rate of about +0.5 °C per decade. It is the fastest warming of all the WMO Regions.
- Average sea-ice extent in the European Arctic sector in September 2021 was the lowest on record for the month (37% below the 1981–2010average), slightly below the previous record from September 2013 (36% below average).
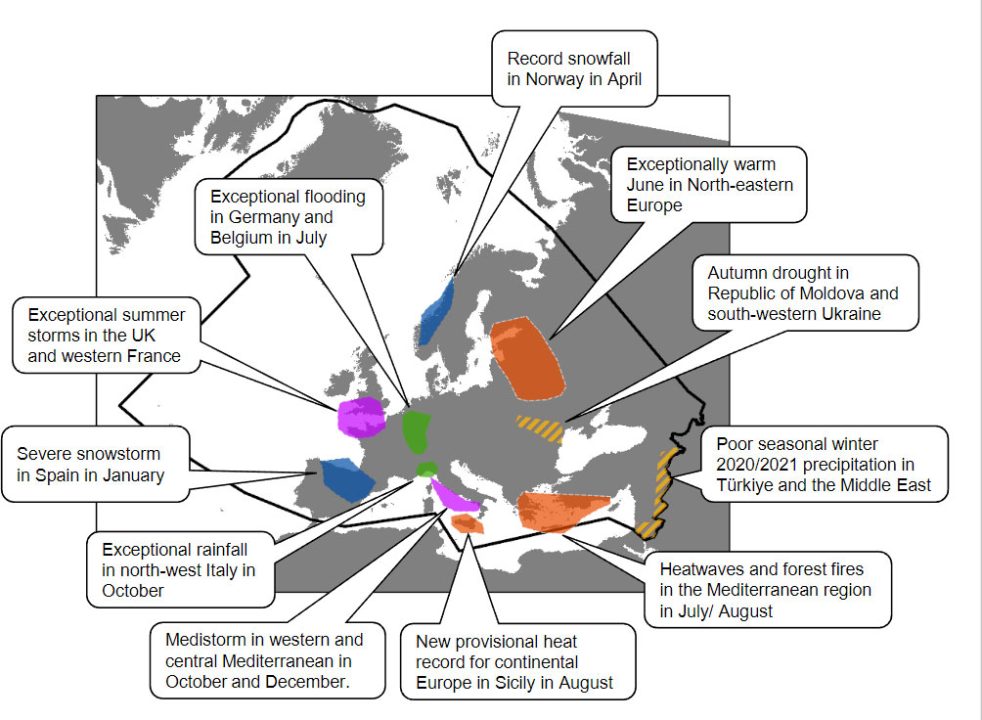
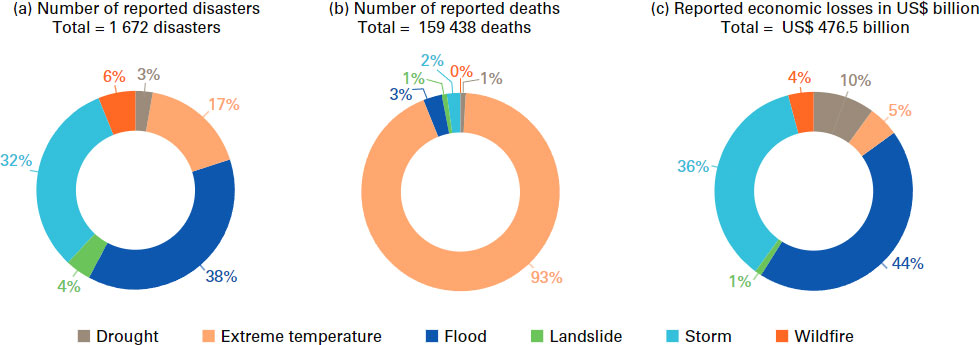
- High-impact weather and climate events led to hundreds of fatalities, directly affected around510 000 people and caused economic damages exceeding US$ 50 billion. About 84% of the events were floods or storms.
- Exceptionally high temperatures and heatwaves occurred in many parts of Europe throughout the summer. On 11 August, a location near Syracuse in Sicily, Italy, reached 48.8 °C, a provisional European record
- An unusual spring cold outbreak affected many parts of Europe in early April, resulting in widespread and severe damage to agriculture, with large losses to vineyards, fruit trees and other crops. In France losses exceeded US$4.6 billion.
- European Union (EU) greenhouse gas emissions decreased 31% between 1990 and 2020 (the net reduction target for 2030 is 55%). While the cut in 2019 was strongly driven by fossil fuel price effects and policy measures, the decline in2020 was additionally related to the COVID-19 pandemic, and 2021 emissions in the EU are expected to be higher than in 2020. In other countries of the region, reductions targets for 2030 range in general from 35% to 55% compared with 1990.
- About 75% of people in Europe are covered by early warning systems (EWSs), and many WMO Members in Europe have an above-average capacity to deliver on all their EWS needs. However, 7 Members (out of the 34 providing data) reported having inadequate end-to-end riverine flood forecasting services, and13 Members reported inadequate end-to-end flash flood forecasting services. This is a concern, considering that in the last 50 years(1970–2019) 38% of the weather, water and climate disasters were related to floods.
- Children are more vulnerable to the impacts of climate change than adults, both physically and psychologically. According to the United Nations Children’s Fund (UNICEF) Children’s Climate Risk Index (CCRI), nearly 125 million children in Europe live in ‘Medium–High’ risk countries (the third of five levels of classification used globally).
- Comprehensive heat-health action plans have been shown to save lives and strengthen the resilience of communities and people to cope with extreme heat. Several European countries have implemented heat health action plans to prevent ill health and excess mortality from heat.
- The European Region is one of the most advanced regions in transboundary cooperation in climate change adaptation. Countries have developed and implemented climate change adaptation strategies and plans and/or integrated climate change adaptation into their planning documents, in particular across several transnational river basins.
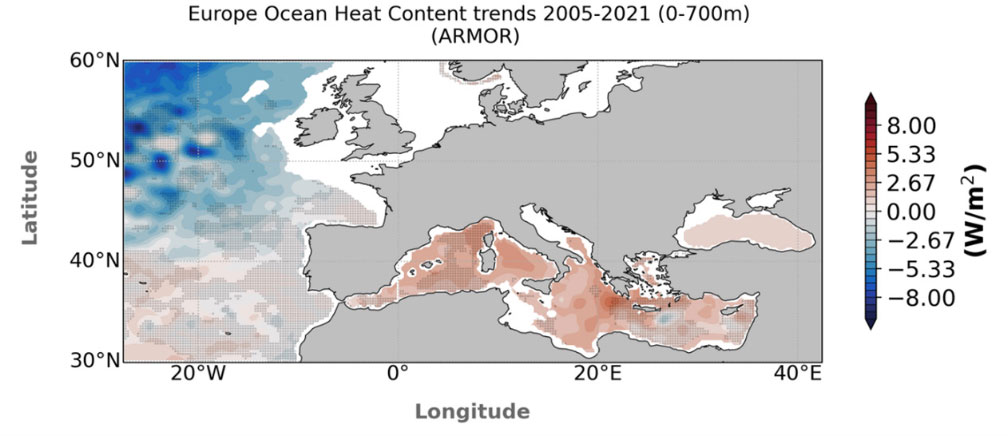
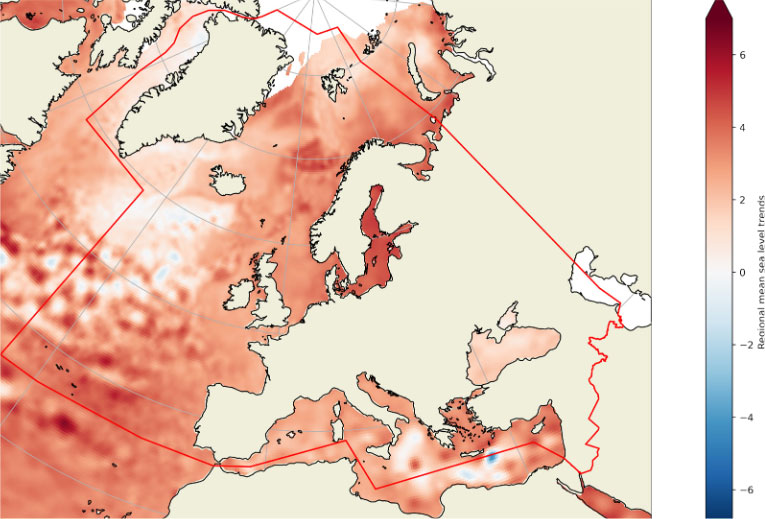
The Guardian: There are a number of reasons why Europe has warmed more quickly than other parts of the world. It has a high percentage of land mass, which warms faster than sea. The Arctic and generally the high northern latitudes are also the fastest warming regions globally and a relatively large part of Europe is in the northern latitudes.
Feedback systems could also be contributing, such as dried-out soil moisture meaning temperatures rise faster, thus drying the soil more. Another example of feedback loops is Europe’s vulnerability to double jet streams.
This “double” effect happens when a jet stream temporarily splits in two, leaving an area of weak winds and high-pressure air between the two branches that causes extreme heat. These double streams become more likely as land mass heats up in early summer.

The Guardian: A study in Nature Communications published earlier this year found that Europe was a “heatwave hotspot”, partly because double jet streams account for about 35% of temperature variability.
Other scientists welcomed the report, pointing out that Europe’s cities were “heat islands” and thus feel extreme temperatures more. Prof Daniela Schmidt, at the Cabot Institute and School of Earth Sciences, University of Bristol, said: “When global warming is reported, the focus is always on the global average, currently 1.1C. But there are large differences, with much of the ocean warming less, land more, and more the further to the poles you go. Our cities on top of this are heat islands, as many of us felt during this hot summer.
“In the UK, this summer’s heatwave resulted in nearly 3,000 additional deaths among people over 65. Heat and droughts together impacted transport on European rivers, energy generation, our ecosystems and our people. These risks will only increase with every increment of warming and reducing these risks harder the longer we wait.”
About the Author: CLIMATE STATE
POPULAR
COMMENTS
- The risk with the path to a hothouse Earth | Climate State on Climate Tipping Points Existential Threat to Our Life Support Systems
- Robert Schreib on Electricity generation prices may increase by as much as 50% if only based on coal and gas
- Robert Schreib on China made a historic commitment to reduce its emissions of greenhouse gases
- Lee Nikki on COP30: Climate Summit 2025 – Intro Climate Action Event
- Hollie Bailey on Leaders doubled down on fossil fuels after promising to reduce climate pollution