Hansen: The World Has Cooled Off – What’s the Significance?
For those wondering, the latest ENSO outlook released in May says that La Nina is over! There is a ~67% chance that neutral conditions will continue through summer. The ENSO forecast for the fall is less confident. #ClimateQA 1/2https://t.co/BAktDhyF4J pic.twitter.com/M5uid8eSp6
— NOAA Climate.gov (@NOAAClimate) June 3, 2021
By James Hansen and Makiko Sato, 13th May 2021 – Global temperature in April continues to be much less than a year ago (Fig. 1: left side). ENSO (El Nino Southern Oscillation) is the principal cause of year-to-year global temperature change.

We are in a moderately strong La Nina (Fig. 1: right side) and NCEP (NOAA’s National Center for Environmental Prediction) current forecast (Fig. 1: right side) suggests that tropical temperatures are headed for a double-dip La Nina. Nino forecasts are notoriously difficult, however, so we need to wait a few months to see.
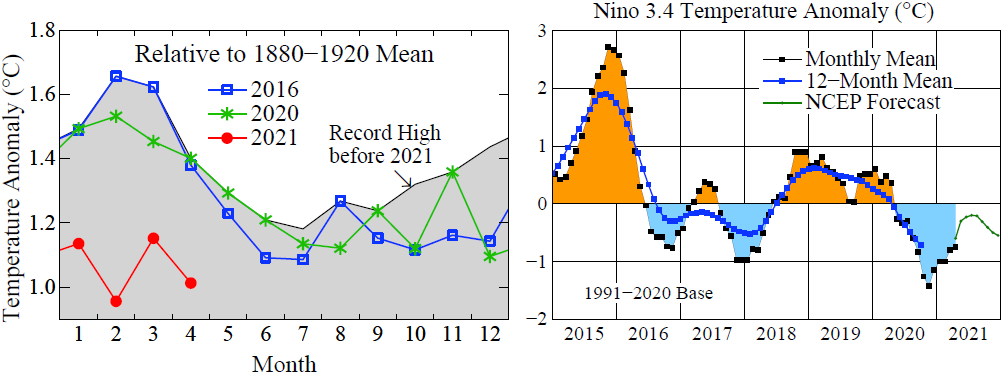
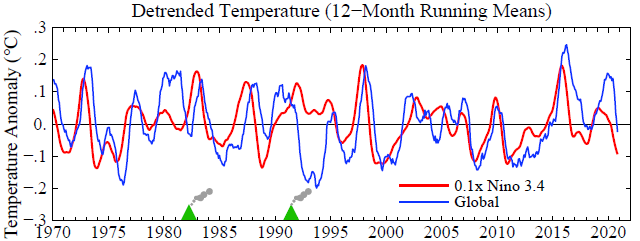
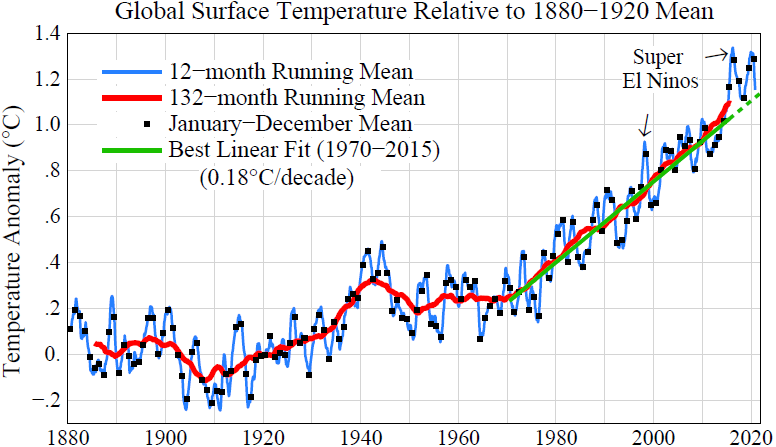
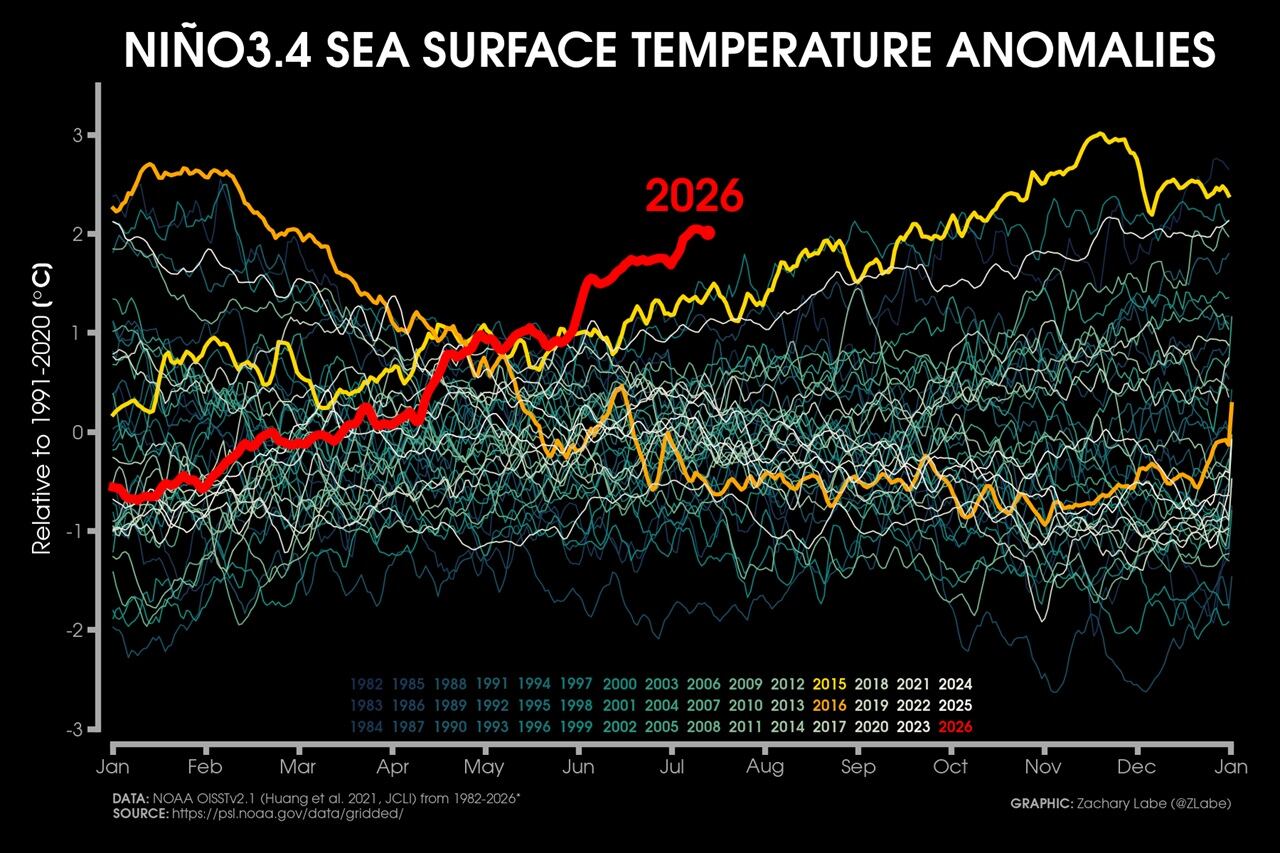
Global temperature is highly correlated (61.4%) with the Nino3.4 index, with global temperature lagging Nino3.4 by 5 months (Fig. 2). The 12-month running mean temperature is dropping fast (Fig. 3) and probably will not reach a minimum until November this year.[1] That minimum is likely to be well below the 1970-2015 trend line (Fig. 3) and 2021 will be much cooler than 2020. Will that global cooling imply that the apparent global warming acceleration of the past six years was a misleading deviation, rather than a significant change of the warming rate?
No, almost surely not. Global temperature will ultimately respond to global climate forcings. We know that Earth is now out of energy balance – more energy coming in than going out – at a record imbalance[2] close to +1 W/m2.
Moreover, greenhouse gases (GHGs) continue to increase rapidly and there is growing evidence that human-made aerosols are decreasing. Aerosols have a cooling effect, so they partially offset GHG warming, but that offset is now decreasing, as we will discuss in a future paper and temperature update.
Let’s look at the primary drive for global warming: increasing GHGs. As we will see – despite international concern about climate change and promises by governments to address the matter – GHG growth rates are increasing, not declining.
The methane (CH4) growth rate[3] is shocking (Fig. 4). A CH4 increase causes tropospheric ozone (O3) and stratospheric water vapor (H2O) to also increase. Including these indirect effects, the climate forcing by observed CH4 growth is half as large as the climate forcing by CO2.
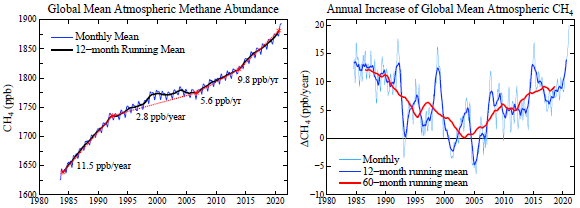
Data source: Ed Dlugokencky, NOAA/GML (https://gml.noaa.gov/ccgg/trends_ch4/)
Data source: NOAA Global Monitoring Lab (https://gml.noaa.gov/ccgg/trends/global.html)
Any realistic plan to limit global warming must include a reduction of atmospheric CH4, as discussed in Young People’s Burden.[4] Such a CH4 reduction is feasible because of the short (about 10 year) lifetime of CH4, but it requires reducing CH4 sources.
Instead, after CH4 nearly stabilized early this century, growth has returned and recently accelerated to its highest rate in the period of accurate global data, with increased growth at least in part as a result of “fracking” for gas and reliance on gas as the complement to intermittent renewable energies.
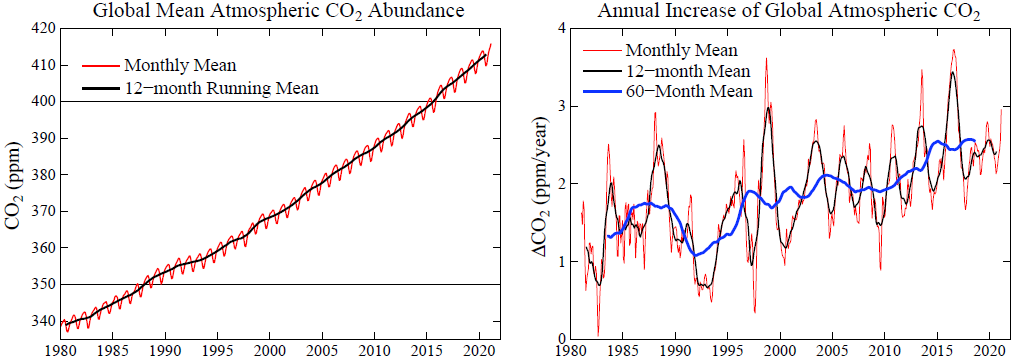
The CO2 growth rate (Fig. 5) is now a bit below the peaks that occur in conjunction with strong El Ninos. However, the CO2 growth rate is not declining. CO2 growth has not even slowed as a result of the reduced economic activity associated with Covid-19.
The growth rate of the third strongest greenhouse gas, N2O, does not provide any good news. Its growth rate (Fig. 6) continues to increase.
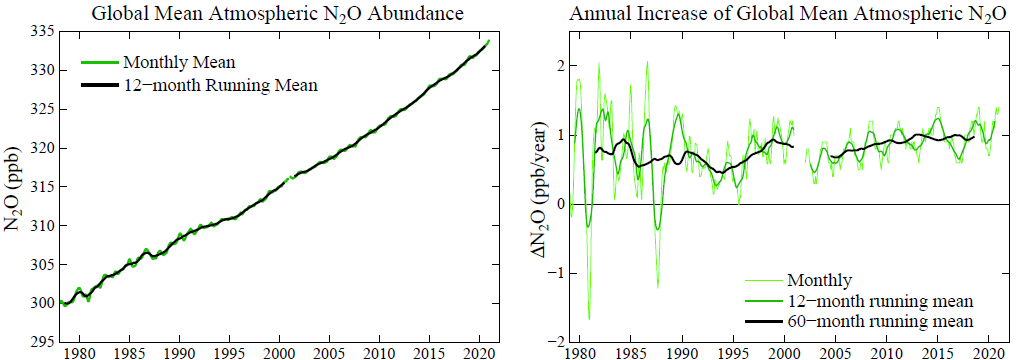
Data source: Ed Dlugokencky, NOAA/GML (gml.noaa.gov/ccgg/trends_n2o/)
There is a wide gap between reality and the picture that governments paint about the status of actions to limit global warming. Actual government policies consist of little more than tinkering with domestic energy sources, plus goals and wishful thinking in international discussions.
Solution of the global warming problem has two fundamental requirements.
The first, underlying, requirement is for a simple rising carbon fee. The fee could be made near global via border duties on products from countries without the fee. The public would accept a rising carbon fee if all of the resulting funds was distributed uniformly to domestic citizens.[5]
The second requirement is for technology to produce baseload dispatchable carbon-free electric power at a price below that of fossil fuels. Based on the price of nuclear fuel and the amount of material (concrete, steel, etc.) in a power plant, one technology with that potential is modern nuclear power.
However, governments chose not to support the development of that technology. Instead, they chose an unlimited hidden subsidy of renewable energies via renewable portfolio standards for electricity as well as explicit subsidies of renewables.
If uniform support had been provided for all clean energies, for example via clean energy portfolio standards, we would now be well on the way to stabilizing climate, and we would have a cleaner, healthier atmosphere.[6]
Our children and grandchildren will pay the price for our energy policy incompetence.
| [1] As we advance one month, the change to the 12-month running mean is obtained by adding the most recent point on the red curve and deleting the same month from the green curve. So as long as the red curve remains below the green one, the 12-month mean will keep declining. Record global temperatures in September and November 2020 are unlikely to be exceeded this year. [2] von Schuckmann, K., et al.: Heat stored in the Earth system: where does the energy go?, Earth System Science Data 12, 2013-2041, 2020. [3] Dlugokencky, E. J., L. P. Steele, P. M. Lang, and K. A. Masarie (1994), The growth rate and distribution of atmospheric methane, J. Geophys. Res., 99, 17,021– 17,043, doi:10.1029/94JD01245. [4] Hansen, J., M. Sato, P. Kharecha, K. von Schuckmann, D.J. Beerling, J. Cao, S. Marcott, V. Masson-Delmotte, M.J. Prather, E.J. Rohling, J. Shakun, P. Smith, A. Lacis, G. Russell, and R. Ruedy, 2017: Young people’s burden: requirement of negative CO2 emissions. Earth Syst. Dynam. 8, 577-616, 2017. [5] Hansen, J.: Student Leadership on Climate Solutions, 31 July 2020. [6] Hansen, J.: Sophie’s Planet #36: Chapter 47 (China and the Global Solution), 4 March 2021. |
RELATED
- State of the climate: 2021 off to cooler start due to fading La Niña https://www.carbonbrief.org/state-of-the-climate-2021-off-to-cooler-start-due-to-fading-la-nina
- Let’s Put a Price on Carbon with Fee and Dividend https://earthclimate.eu/2014/03/25/lets-put-a-price-on-carbon-with-fee-and-dividend/
Support Earth Climate

About the Author: EARTH CLIMATE
Newsletter
Recent Comments
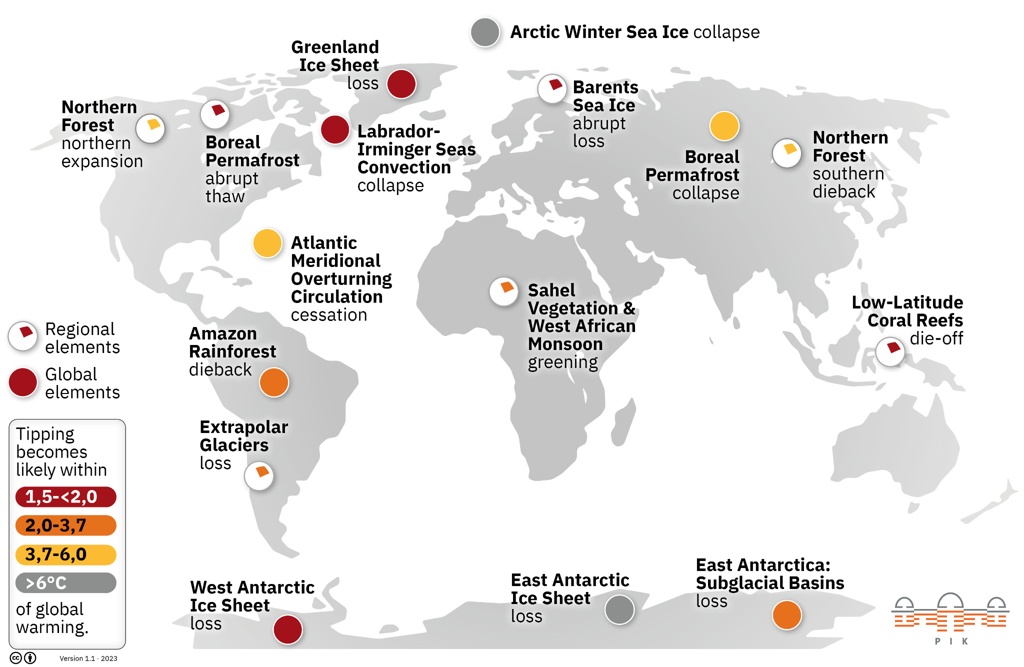
- America’s Climate Free Fall – CounterPunch.org – Theothernews on Climate Free Fall: Scientists Warn of Hidden Economic Crisis, Earth’s Systems Become Dangerously Unstable
- Climate Researcher Levermann: "We Must Understand What Happens After Climate Systems Tip" | EarthClimate on Climate Free Fall: Scientists Warn of Hidden Economic Crisis, Earth’s Systems Become Dangerously Unstable
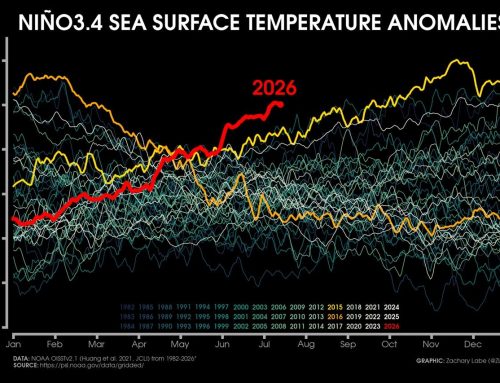
- Extreme Temperature Diary- Saturday July 18th, 2026/Main Topic: The “Super” El Niño of 2026: Why 2027 Will Be a Year That Is Off the Chain Hot – Guy On Climate on The “Super” El Niño of 2026: Why 2027 Will Be the Year the World Watches
Support
We create visually compelling, accessible science content that transforms complex research into engaging videos and articles, helping millions understand the discoveries shaping our world. [Paypal | Patreon]