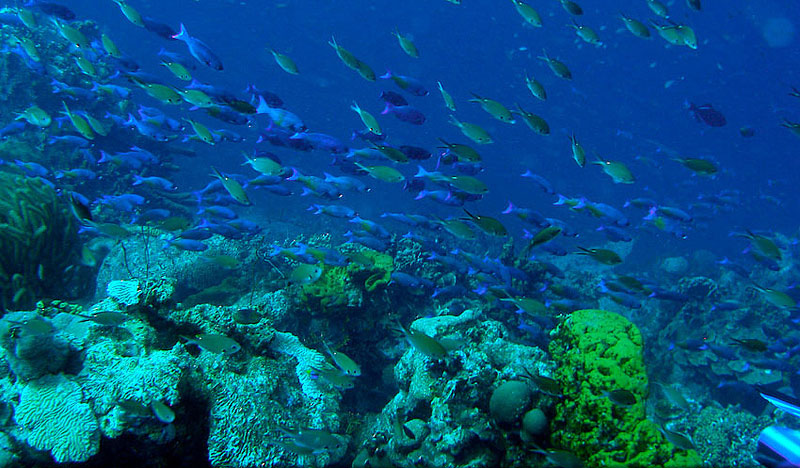
State of the Ocean: Ocean Acidification and Previous Marine Extinctions
https://www.youtube.com/watch?v=vkNns0-w79Q The 2013 report on the State of the Ocean, by [...]
https://www.youtube.com/watch?v=vkNns0-w79Q The 2013 report on the State of the Ocean, by [...]
2013: For the 5th time in 23 years, the world's [...]

New data visualizations from the NASA Center for Climate Simulation [...]

Oceanic heat content (OHC) is the heat stored in the ocean. Oceanography and climatology are [...]

IPCC AR5 WG1 2013 On September 27th 2013 the IPCC [...]

Stephen Henry Schneider (February 11, 1945 — July 19, 2010) [...]

On 27 September 2013, the Intergovernmental Panel on Climate Change [...]
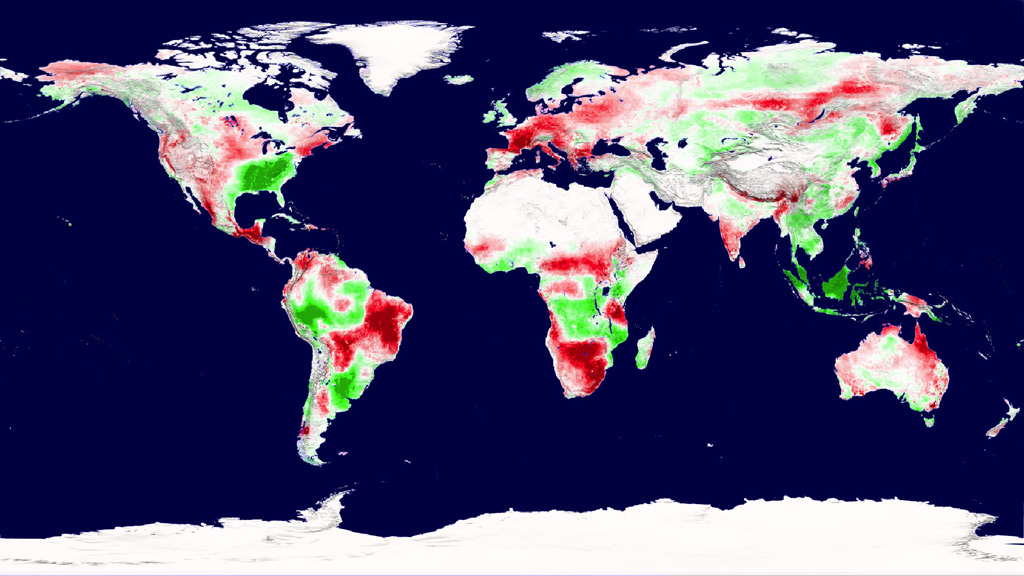
NASA: Drought Drives Decade-Long Decline in Plant Growth Source: Earth [...]

September 15, 2013 by Richard Harris from NPR - Scientists [...]
An international array of Argo floats, measuring ocean heat content to a depth of 2000m, allowing the best assessment so far of Earth's energy imbalance.

Climate sensitivity in its most basic form is defined as the equilibrium change in global surface temperature that occurs in response to a climate forcing, or externally imposed perturbation of the planetary energy balance.
Areas of the coastal ocean where oxygen is low or absent in bottom waters, so-called dead zones, are expanding worldwide.