NASA: Warming-Driven Changes in Global Rainfall
A NASA-led modeling study provides new evidence that global warming may increase the risk for extreme rainfall and drought.
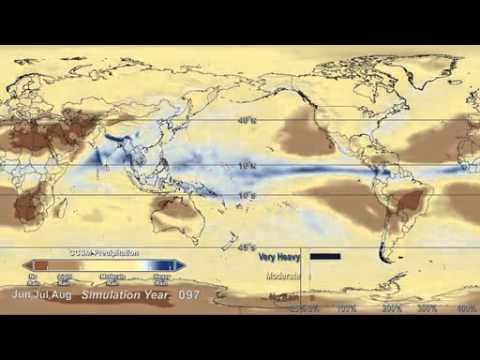
NASA: Model simulations spanning 140 years show that warming from carbon dioxide will change the frequency that regions around the planet receive no rain (brown), moderate rain (tan), and very heavy rain (blue). The occurrence of no rain and heavy rain will increase, while moderate rainfall will decrease.
“In response to carbon dioxide-induced warming, the global water cycle undergoes a gigantic competition for moisture resulting in a global pattern of increased heavy rain, decreased moderate rain, and prolonged droughts in certain regions,” said William Lau of NASA’s Goddard Space Flight Center in Greenbelt, Md., and lead author of the study.
The models project for every 1 degree Fahrenheit of carbon dioxide-induced warming, heavy rainfall will increase globally by 3.9 percent and light rain will increase globally by 1 percent. However, total global rainfall is not projected to change much because moderate rainfall will decrease globally by 1.4 percent.
Heavy rainfall is defined as months that receive an average of more than about 0.35 of an inch per day. Light rain is defined as months that receive an average of less than 0.01 of an inch per day. Moderate rainfall is defined as months that receive an average of between about 0.04 to 0.09 of an inch per day.
Areas projected to see the most significant increase in heavy rainfall are in the tropical zones around the equator, particularly in the Pacific Ocean and Asian monsoon regions.
Some regions outside the tropics may have no rainfall at all. The models also projected for every degree Fahrenheit of warming, the length of periods with no rain will increase globally by 2.6 percent. In the Northern Hemisphere, areas most likely to be affected include the deserts and arid regions of the southwest United States, Mexico, North Africa, the Middle East, Pakistan, and northwestern China. In the Southern Hemisphere, drought becomes more likely in South Africa, northwestern Australia, coastal Central America and northeastern Brazil.
“Large changes in moderate rainfall, as well as prolonged no-rain events, can have the most impact on society because they occur in regions where most people live,” Lau said. “Ironically, the regions of heavier rainfall, except for the Asian monsoon, may have the smallest societal impact because they usually occur over the ocean.”
Lau and colleagues based their analysis on the outputs of 14 climate models in simulations of 140-year periods. The simulations began with carbon dioxide concentrations at about 280 parts per million — similar to pre-industrial levels and well below the current level of almost 400 parts per million — and then increased by 1 percent per year. The rate of increase is consistent with a “business as usual” trajectory of the greenhouse gas as described by the United Nations’ Intergovernmental Panel on Climate Change.
Analyzing the model results, Lau and his co-authors calculated statistics on the rainfall responses for a 27-year control period at the beginning of the simulation, and also for 27-year periods around the time of doubling and tripling of carbon dioxide concentrations.
They conclude the model predictions of how much rain will fall at any one location as the climate warms are not very reliable.“But if we look at the entire spectrum of rainfall types we see all the models agree in a very fundamental way — projecting more heavy rain, less moderate rain events, and prolonged droughts,” Lau said.
