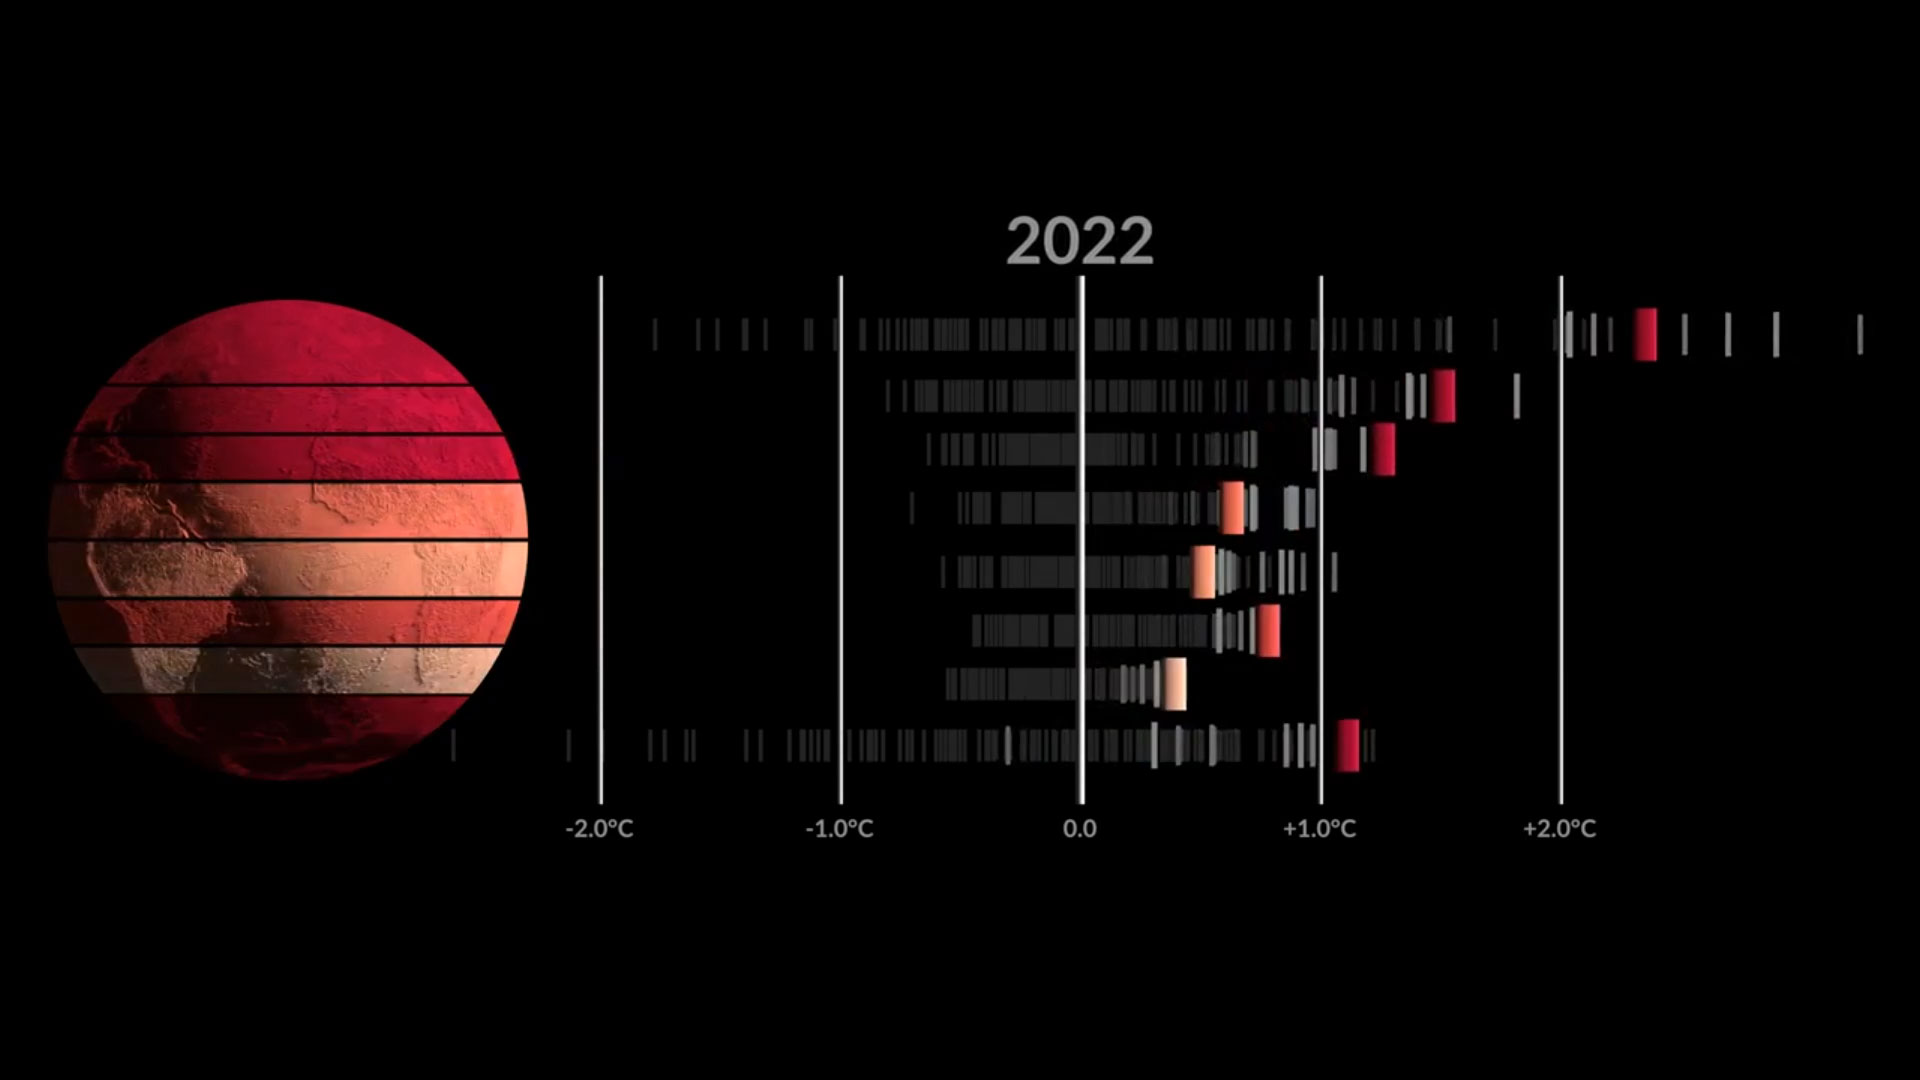
Global Warming by Latitude Zone (1880-2022)
Published On: April 18, 2023
Global warming isn't uniform around the planet.
This visualization shows global temperature changes per latitude zone from 1880 to 2022, illustrating that the Arctic is warming much faster than other regions on Earth.
Discover the non-uniformity of global warming through this informative visualization! See how temperature changes vary across latitudes since 1880. Learn how the Arctic is warming at an alarming rate compared to other regions on Earth. Explore temperature anomalies based on NASA data relative to a base period of 1951 to 1980.
These changes, called “anomalies” (how much warmer or cooler something is compared to an average), are defined relative to a base period of 1951 to 1980 and are based on NASA data.
About the Author: Chris Machens
Chris covers the climate and extreme weather, and when not posting articles to the site he works on our next video production.
Subscribe
Login
0 Comments
Oldest
Newest
Inline Feedbacks
View all comments
