James Hansen: May 2021 Global Temperature Update

On the longer run, global temperature will increase in response to the present large planetary energy imbalance (absorbed solar energy exceeds thermal emission to space by about +1 W/m2)[1] and the continuing growth of human-made greenhouse gases. In addition, solar irradiance reached the minimum of the present solar cycle during 2019, so for about the next six years solar irradiance will add a small positive (warming) forcing (global temperature response to solar cycle forcing lags the solar cycle by 1-2 years due to the climate system’s thermal inertia).
Global temperature should reach about +1.5°C in conjunction with the next El Nino.
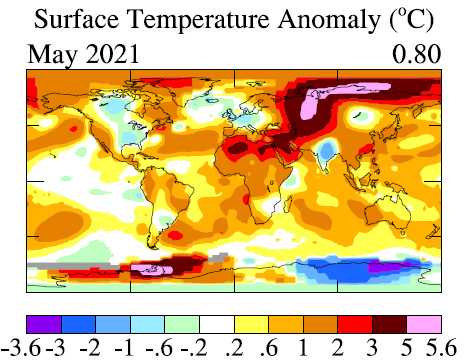
Local monthly temperature anomalies routinely exceed global mean warming. Much of North America, Western Europe, India and Eastern Antarctica experienced negative temperature anomalies in May relative to the 1951-1980 average (Fig. 3). The largest positive anomalies were in Central Asia, the Arctic and Western Antarctica.
[1] von Schuckmann, K., et al.: Heat stored in the Earth system: where does the energy go?, Earth System Science Data 12, 2013-2041, 2020.
12-month global temperature should reach minimum near +1.1C in late 2021. Maximum at next El Nino is likely to be near +1.5C due to rising CO 2 , CH 4 , N 2 O, solar irradiance and Earth’s energy imbalance. See May Update: https://t.co/AVMfqOlUqR pic.twitter.com/zVQhhkKTYk
— James Edward Hansen (@DrJamesEHansen) June 14, 2021
Climate scientists James Hansen and Makiko Sato posted a temperature update for the year 2021.
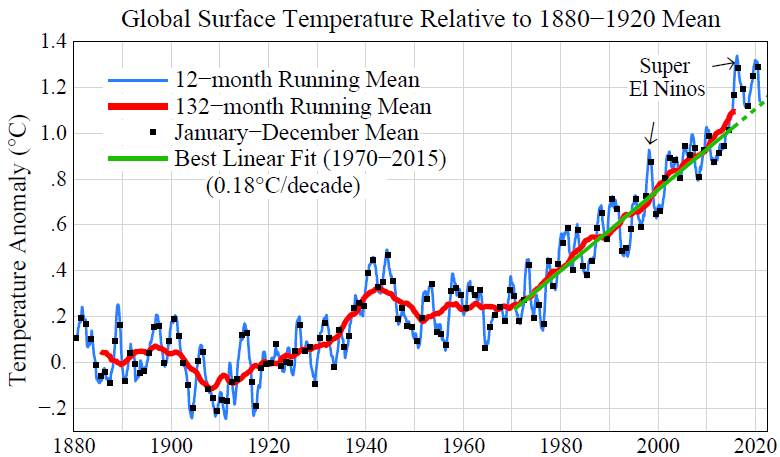
By James Hansen and Makiko Sato: Global temperature in May was +1.07°C (relative to the 1880-1920 base period, which is a best estimate of preindustrial temperature). The temperature was well below a year earlier (Fig. 1), as expected due to the La Nina that peaked in November 2020. Global temperature anomalies are correlated with ENSO (El Nino Southern Oscillation), with global temperature lagging the Nino 3.4 index by 5 months on average (Fig. 1 in our April 2021 Temperature Update).
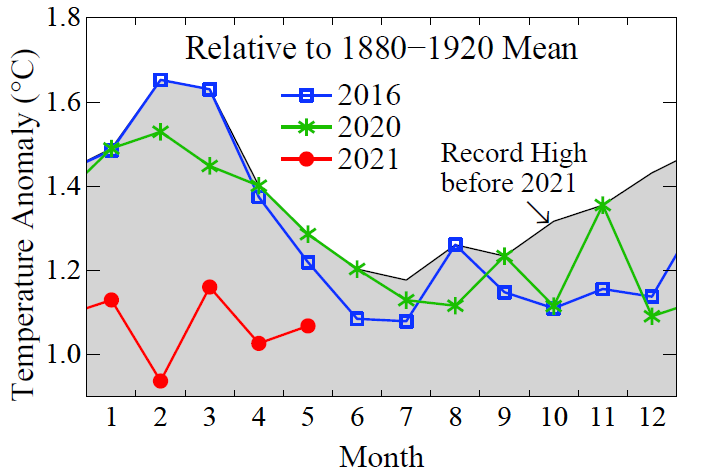
The 12-month running-mean global temperature (blue line in Fig. 2) at +1.13°C is now near the 1970-2015 trend line. This 12-month mean should continue to fall during the next six months, reaching a minimum in November, as discussed in the April 2021 Temperature update.
On the longer run, global temperature will increase in response to the present large planetary energy imbalance (absorbed solar energy exceeds thermal emission to space by about +1 W/m2)[1] and the continuing growth of human-made greenhouse gases. In addition, solar irradiance reached the minimum of the present solar cycle during 2019, so for about the next six years solar irradiance will add a small positive (warming) forcing (global temperature response to solar cycle forcing lags the solar cycle by 1-2 years due to the climate system’s thermal inertia).
Global temperature should reach about +1.5°C in conjunction with the next El Nino.
Local monthly temperature anomalies routinely exceed global mean warming. Much of North America, Western Europe, India and Eastern Antarctica experienced negative temperature anomalies in May relative to the 1951-1980 average (Fig. 3). The largest positive anomalies were in Central Asia, the Arctic and Western Antarctica.
[1] von Schuckmann, K., et al.: Heat stored in the Earth system: where does the energy go?, Earth System Science Data 12, 2013-2041, 2020.
12-month global temperature should reach minimum near +1.1C in late 2021. Maximum at next El Nino is likely to be near +1.5C due to rising CO 2 , CH 4 , N 2 O, solar irradiance and Earth’s energy imbalance. See May Update: https://t.co/AVMfqOlUqR pic.twitter.com/zVQhhkKTYk
— James Edward Hansen (@DrJamesEHansen) June 14, 2021
Climate scientists James Hansen and Makiko Sato posted a temperature update for the year 2021.
By James Hansen and Makiko Sato: Global temperature in May was +1.07°C (relative to the 1880-1920 base period, which is a best estimate of preindustrial temperature). The temperature was well below a year earlier (Fig. 1), as expected due to the La Nina that peaked in November 2020. Global temperature anomalies are correlated with ENSO (El Nino Southern Oscillation), with global temperature lagging the Nino 3.4 index by 5 months on average (Fig. 1 in our April 2021 Temperature Update).
The 12-month running-mean global temperature (blue line in Fig. 2) at +1.13°C is now near the 1970-2015 trend line. This 12-month mean should continue to fall during the next six months, reaching a minimum in November, as discussed in the April 2021 Temperature update.
On the longer run, global temperature will increase in response to the present large planetary energy imbalance (absorbed solar energy exceeds thermal emission to space by about +1 W/m2)[1] and the continuing growth of human-made greenhouse gases. In addition, solar irradiance reached the minimum of the present solar cycle during 2019, so for about the next six years solar irradiance will add a small positive (warming) forcing (global temperature response to solar cycle forcing lags the solar cycle by 1-2 years due to the climate system’s thermal inertia).
Global temperature should reach about +1.5°C in conjunction with the next El Nino.
Local monthly temperature anomalies routinely exceed global mean warming. Much of North America, Western Europe, India and Eastern Antarctica experienced negative temperature anomalies in May relative to the 1951-1980 average (Fig. 3). The largest positive anomalies were in Central Asia, the Arctic and Western Antarctica.
[1] von Schuckmann, K., et al.: Heat stored in the Earth system: where does the energy go?, Earth System Science Data 12, 2013-2041, 2020.
12-month global temperature should reach minimum near +1.1C in late 2021. Maximum at next El Nino is likely to be near +1.5C due to rising CO 2 , CH 4 , N 2 O, solar irradiance and Earth’s energy imbalance. See May Update: https://t.co/AVMfqOlUqR pic.twitter.com/zVQhhkKTYk
— James Edward Hansen (@DrJamesEHansen) June 14, 2021
About the Author: EARTH CLIMATE
Support
We create visually compelling, accessible science content that transforms complex research into engaging videos and articles, helping millions understand the discoveries shaping our world. Paypal Donations | Patreon