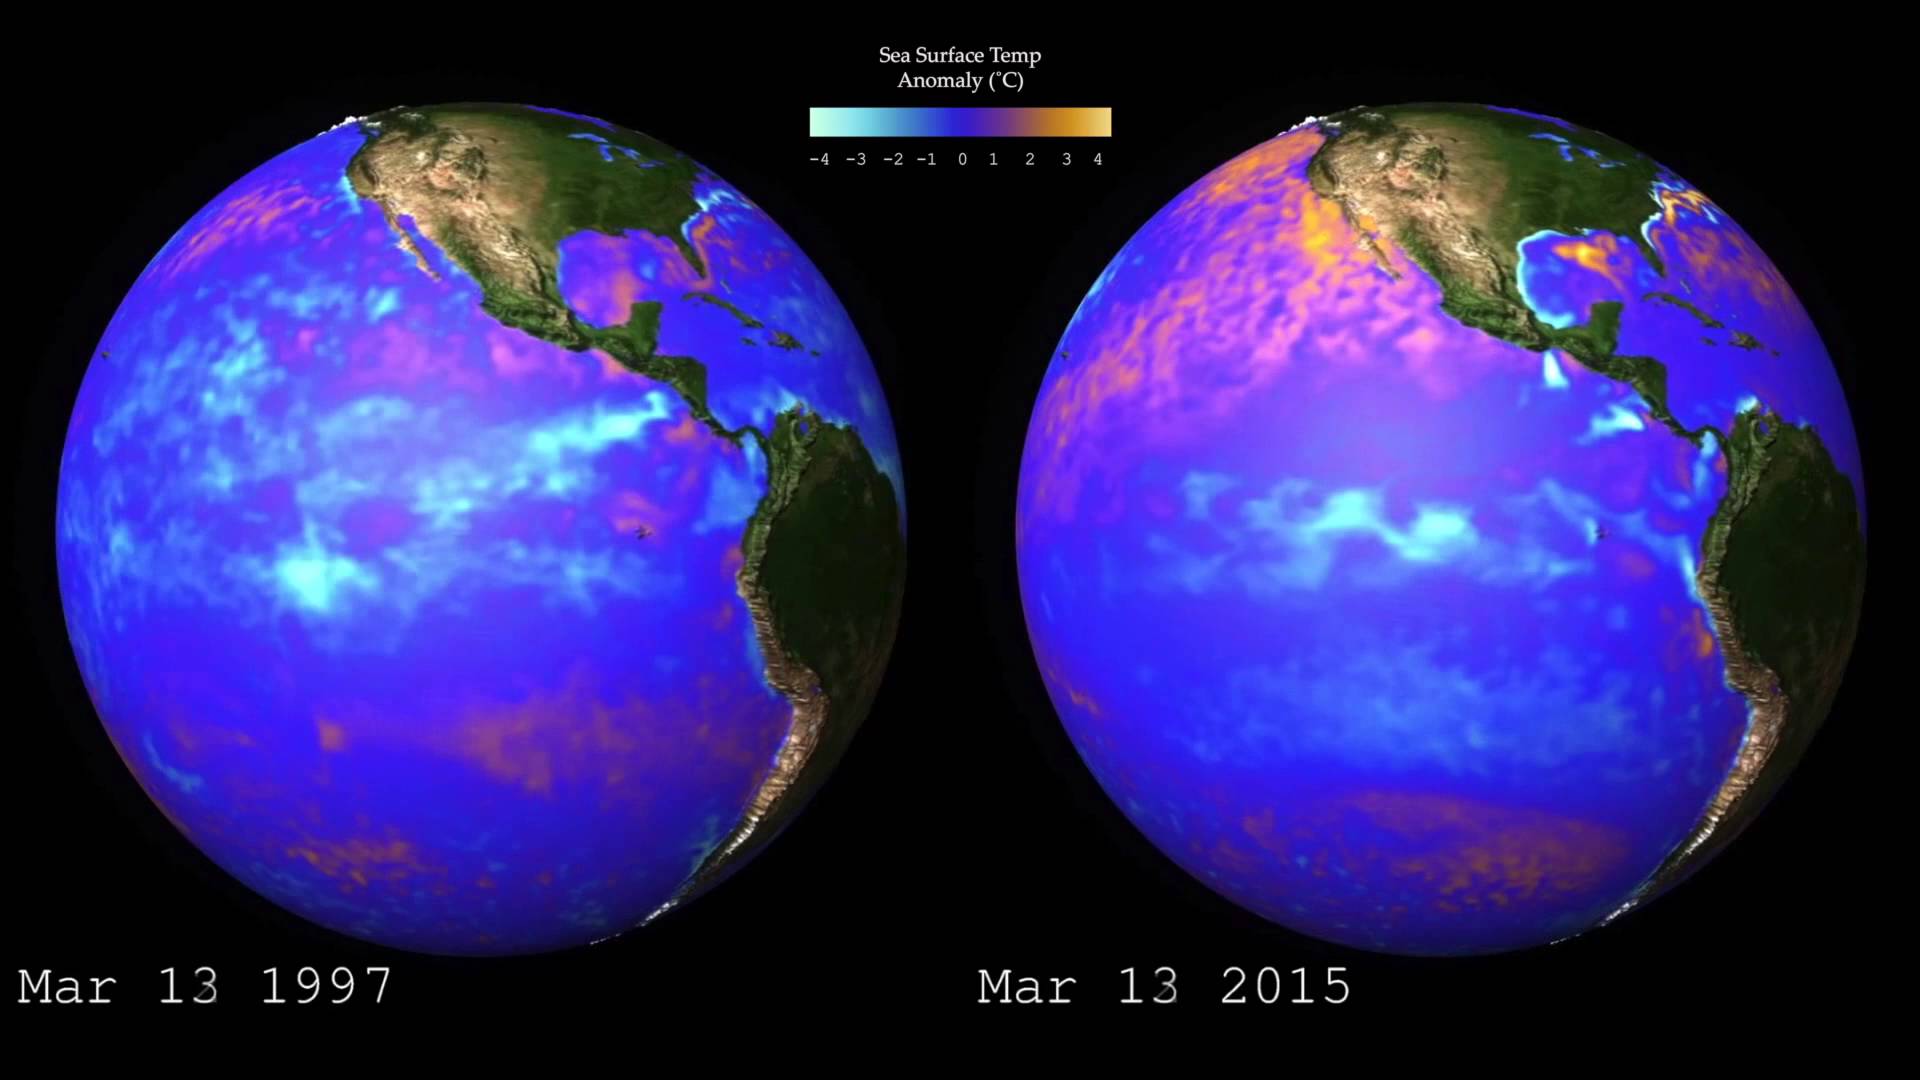
1997 and 2015 El Niño Sea Surface Temperature Anomalies (Video)
Published On: September 5, 2015
A brief comparison of changes in sea surface temperature (SST) […]
A brief comparison of changes in sea surface temperature (SST) anomalies between the major El Niño event of 1997-98 and the El Niño event emerging in 2015.
The visualization depicts data from the NOAA 1/4° daily Optimum Interpolation Sea Surface Temperature (OISST). The data are combined from sources such as satellites, buoy networks, and ships. The OISST analyses are named for the key satellite sensor used: in this case, the Advanced Very High Resolution Radiometer (AVHRR).
-
- More about OISST/AVHRR: https://www.ncdc.noaa.gov/oisst
- More about El Niño and La Niña: http://www2.ucar.edu/news/backgrounders/el-nino-la-nina-enso
Visualization and Postproduction Matt Rehme (NCAR/CISL)
Related
- 1997 vs. 2015: Animation Compares El Niños Side-by-Side (Climate Central)
- Will a 2015 Arctic sea ice melt season during an El Nino year shatter previous records? http://climatestate.com/2015/05/15/will-a-2015-arctic-sea-ice-melt-season-during-an-el-nino-year-shatter-previous-records/
Tags: 2015, El Nino, NCAR, Ocean, Science, Study, surface temperatures, Temperature Anomaly, Video(2023)
Views: 224
About the Author: Climate State
Climate State covers the broad spectrum of climate change, and the solutions, since 2011 with the focus on the sciences. Climate State – we endorse data, facts, empirical evidence.
Subscribe
Login
0 Comments
Oldest
Newest
Inline Feedbacks
View all comments
