Michael Mann: The Hockey Stick and Climate Wars
For the Yale Forum on Climate Change & The Media focuses on climate scientist Michael Mann and his first-hand view of his hockey stick and ‘climate wars’ experiences.
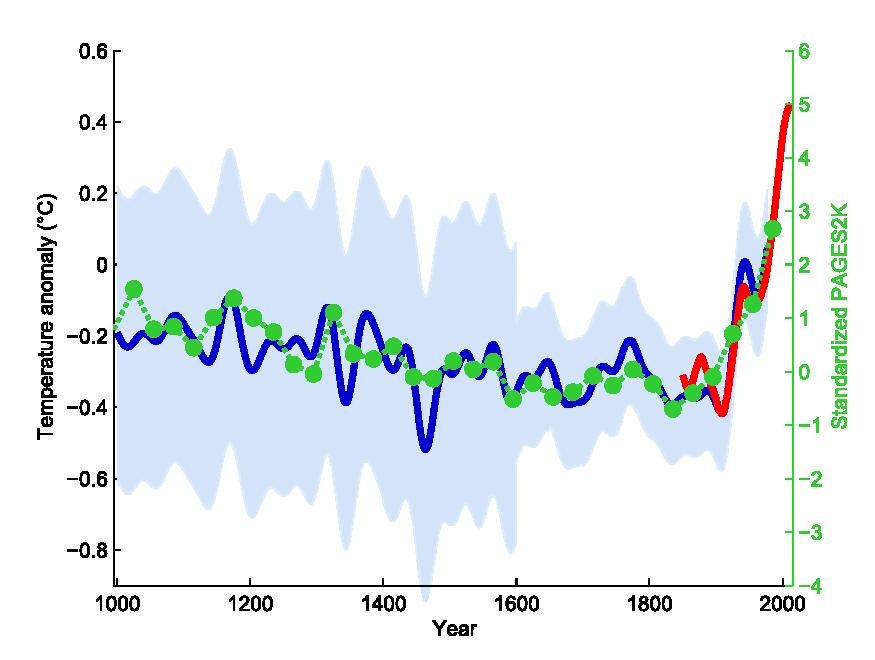
The original northern hemisphere hockey stick graph of Mann, Bradley & Hughes 1999, smoothed curve shown in blue with its uncertainty range in light blue, overlaid with green dots showing the 30-year global average of the PAGES 2k Consortium 2013 reconstruction. The red curve shows measured global mean temperature, according to HadCRUT4 data from 1850 to 2013.
Tags: 2012, Climate Denial, Climate Science, Climate Wars, Hockey Stick, Joe Barton, John Christy, Michael Mann, Peter Sinclair, Politics, United States, Video, Yale Climate Connections
Categories: Climate Change, Climate Change Denial, Climate Policy, North America, Politics, Science, United States, Video, World News
About the Author: CLIMATE STATE
CLIMATE STATE covers the broad spectrum of climate change, and the solutions, with the focus on the sciences. Climate State – we endorse data, facts, empirical evidence.
Subscribe
Login
Please login to comment
0 Comments
Oldest
Newest
Inline Feedbacks
View all comments
POPULAR
COMMENTS
- The risk with the path to a hothouse Earth | Climate State on Climate Tipping Points Existential Threat to Our Life Support Systems
- Robert Schreib on Electricity generation prices may increase by as much as 50% if only based on coal and gas
- Robert Schreib on China made a historic commitment to reduce its emissions of greenhouse gases
- Lee Nikki on COP30: Climate Summit 2025 – Intro Climate Action Event
- Hollie Bailey on Leaders doubled down on fossil fuels after promising to reduce climate pollution