CarbonBrief: ‘Exceptional’ surge in methane emissions from wetlands worries scientists
CarbonBrief: From the Arctic to the tropics, wetlands encompass around 6% of the planet’s surface. These waterlogged soils are the planet’s largest natural source of methane – a potent greenhouse gas that plays a key role in global temperature rise.
As climate change raises global temperatures and disrupts rainfall patterns, wetlands are releasing methane into the atmosphere more rapidly – a phenomenon known as the “wetland methane feedback”.
New research, published as a “brief communication” in Nature Climate Change, finds that 2020-21 marked “exceptional” growth in wetland methane emissions.
The paper adds that tropical wetlands in particular are “hotspots” of methane wetland emissions, with South America the largest contributor to increased tropical wetland emissions over the 21st century.
Meanwhile, a separate study – also published in Nature Climate Change – finds that global warming is also affecting wetland emissions of carbon dioxide and nitrous oxide.
The paper concludes that “warming undermines the mitigation potential of pristine wetlands even for a limited temperature increase of 1.5-2C”.
The wetland methane feedback
Methane is a potent greenhouse gas that has caused around 30% of all human-caused global warming since the Industrial Revolution. Most methane emissions come from human activity – including from the fossil fuel industry, landfill sites and agriculture.
In 2021, the US, EU, Indonesia, Canada, Brazil, UK and many others signed the “Global Methane Pledge” promising to cut their methane emissions by 30% over 2020-30.
Meanwhile, a report published last year by the International Energy Agency’s global methane tracker concluded that “the most cost-effective opportunities for methane abatement are in the energy sector, especially in oil and gas operations”.
However, 40% of methane emissions are from natural sources. Waterlogged soils called wetlands, which are inundated with water for at least part of the year, are the world’s largest natural source of methane emissions.
Wetlands take many different forms, ranging from Arctic permafrost peatlands to tropical mangrove plantations to salt marshes. Around 40% of all species live or breed in wetlands. They also provide key ecosystem services, such as water filtration and are important carbon sinks. As such, wetland restoration is often discussed as an important climate mitigation option.
However, wetlands also release greenhouse gases into the atmosphere. The new study explores how climate change is affecting methane emissions in two key types of wetlands – permafrost wetlands and tropical wetlands.
Found in cold temperatures at high latitudes, permafrost wetlands consist of partially frozen and waterlogged soils. As the climate warms and the permafrost thaws, long-dormant microbes are starting to “wake up” and release methane into the atmosphere.
Meanwhile, tropical wetlands which are typically found in hot and humid climates. As the changing climate causes shifts in rainfall patterns, new soils are becoming waterlogged and these wetlands are expanding, the paper says.
Overall, this means that global warming is driving greater wetland methane emissions. This process is called the “wetland methane feedback”.
Underestimating emissions
The paper assesses the wetland methane feedback using two different types of data – samples collected over many decades of fieldwork and “reanalysis” data that combines observations from multiple sources with model simulations.
The authors use the two data sources to run simulations of a wetland methane model, which they use to project future methane emissions from both tropical and permafrost wetlands under a range of warming scenarios.
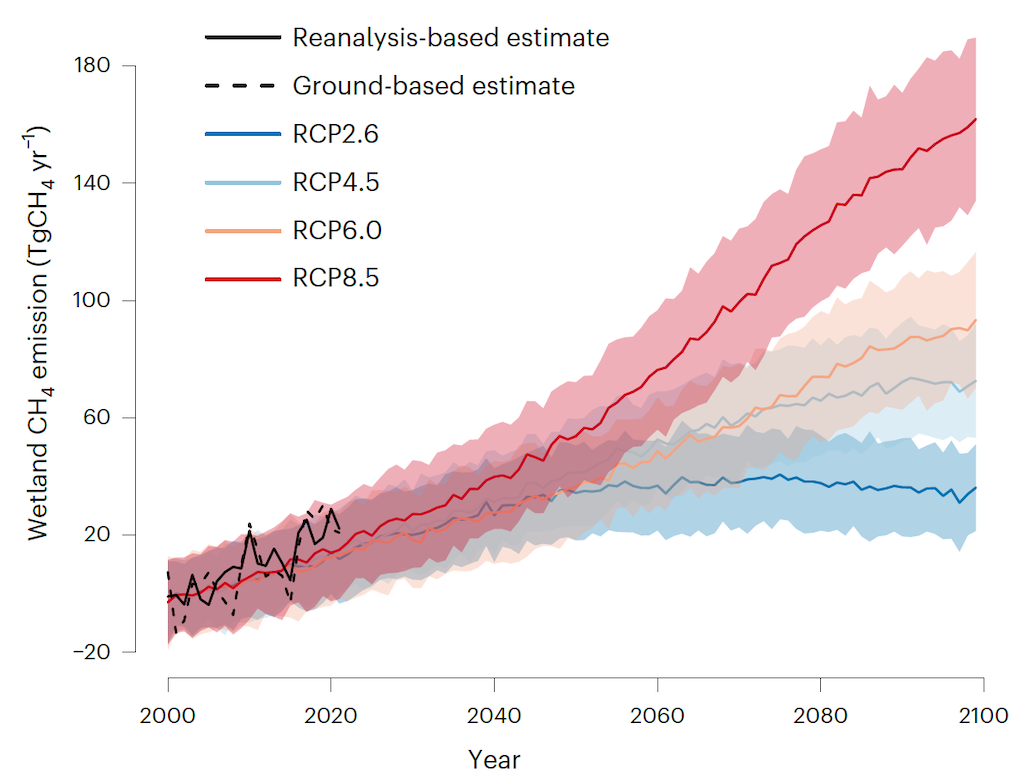
The plot below shows wetland methane emissions over 2000-22, relative to 2000-06 levels, as estimated by fieldwork data (dotted black line) and reanalysis data (solid black line). It also shows projected emissions taken from the fifth Coupled Model Intercomparison Project (CMIP5) up to the year 2100. CMIP is a framework for climate model experiments, which allows scientists to study and compare the outputs of different climate models.
The dark blue, light blue, yellow and red lines show, respectively, the low (RCP2.6), moderate (RCP4.5), high (RCP 6.0) and extremely high (RCP8.5) emissions scenarios.

Observed and projected methane emissions over 2000-2100, relative to 2000-06 levels, measured using fieldwork data (dotted black line) and reanalysis data (solid black line) and CMIP5 projections, where dark blue, light blue, yellow and red lines show the low, moderate, high and extremely high global warming scenarios, respectively. For each warming scenario, the model mean (solid line) and one standard deviation range (shading) is shown. Source: Zhang et al (2023).
The authors find that, over the past 20 years, wetland methane emissions have risen by 1.2-1.4m tonnes per year. This is faster than the average projection under the most pessimistic emission scenario (RCP8.5), which shows growth of 0.9m tonnes of methane per year.
The authors also found an “exceptional” increase in methane emissions over 2020-21.
Global average annual emissions increased by 8-10m tonnes per year over 2007-21 due to climate change, compared to a 2000-06 baseline. However, emissions grew by 14-26m tonnes in 2020 and 13-23m tonnes in 2021.
Dr Benjamin Poulter is a research scientist at the NASA Goddard Space Flight Center and author on the study. He tells Carbon Brief that it has been hard to attribute methane emissions to climate change due to high year-to-year variability in the climate, but says “we’re becoming more confident now that we do see a climate change impact on methane emissions”.
Prof Grant Allen from the University of Manchester, who was not involved in the study, tells Carbon Brief that the paper “adds further weight to conclusions made in many other recent studies that methane emissions associated with wetlands are rising fast in response to positive climate feedbacks”.
Tropical ‘hotspots’
To investigate the rise in global wetland methane emissions in more detail, the authors examined the emissions by continent.
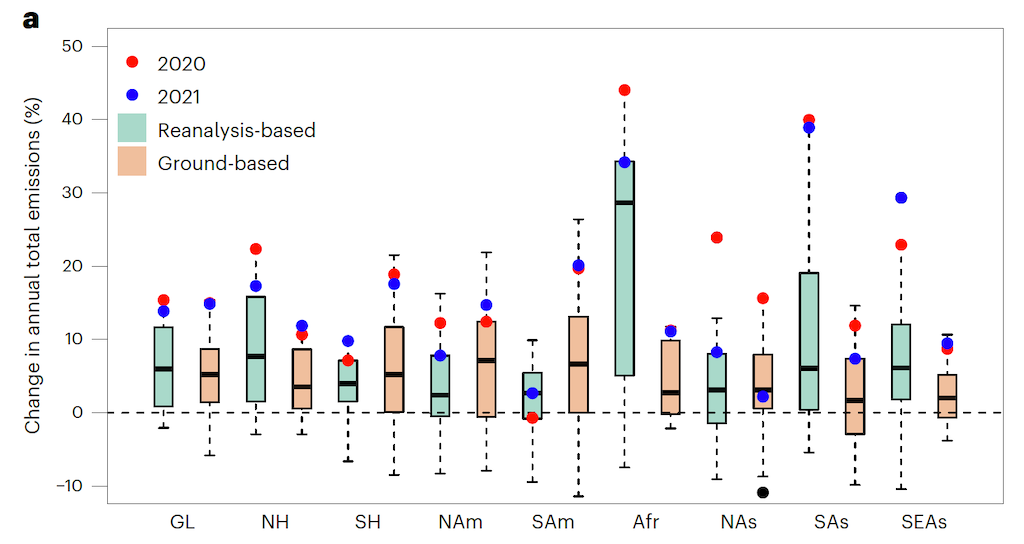
The plot below shows the percentage increase in wetland methane emissions, measured using fieldwork data (orange) and reanalysis data (green), over 2000-21, compared to the 2000-06 baseline. The “exceptional” methane emission years of 2020 and 2021 are shown by the red and blue dots.
Results are shown for the globe (GL), northern hemisphere (NH), southern hemisphere (SH), North America (NAm), South America (SAm), Africa (Afr), north Asia (NAs), south Asia (SAs) and south-east Asia (SEAs).

Percentage increase in wetland methane emissions, measured using fieldwork data (orange) and reanalysis data (green), over 2000-21, compared to the 2000-06 baseline, for the globe (GL), northern hemisphere (NH), southern hemisphere (SH), North America (NAm), South America (SAm), Africa (Afr), north Asia (NAs), south Asia (SAs) and south-east Asia (SEAs). The “exceptional” emission years of 2020 and 2021 are shown by the red and blue dots. Source: Zhang et al (2023).
Ground-based data shows that South America was the largest contributor to global wetland methane emissions, while satellite data indicates that south Asia and south-east Asia also played a part.
The study concludes that the greatest increase in global wetland methane emissions comes from tropical wetlands, while high-latitude permafrost peatland regions have contributed less.
The models in the study “fit with the observations by satellite remote sensing that some tropical wetlands are spreading, getting wetter and warmer,” says Prof Euan Nisbet – an emeritus professor at Royal Holloway University of London – in an accompanying comment paper. He continues:
“Satellite observations found most of methane’s recent growth comes from increased emissions, especially from the inundation of African wetlands. The findings are supported by the large emissions recently measured in low-flying aircraft campaigns over wetlands in Bolivian and Brazilian Amazonia, and over the Upper Congo and Zambezi basins in Zambia. Over major Zambian wetlands, for example, methane emissions were an order of magnitude greater than those simulated in land surface models.”
Although the wetland methane feedback is well established in the scientific literature, scientists have often “struggled” to represent wetland methane emissions in models, Poulter tells Carbon Brief.
The authors of the study warn that most Earth system models and integrated assessment models – which are used to inform influential reports, such as the latest Intergovernmental Panel on Climate Change assessment reports (IPCC) – do not directly incorporate this process into their climate models.
Dr Gabrielle Dreyfus is the chief scientist at the Institute for Governance and Sustainable Development – a US-based non-profit organisation – and was also not involved in the study. She tells Carbon Brief that current IPCC emissions pathways require “rapid and deep reductions in methane emissions associated with human activities” to limit warming to 1.5C. However, these “assume very limited increases in methane emissions from natural sources”.
In light of the new work on the wetland methane feedback, she concludes:
“The gaps highlighted in this study point to a future where mitigating human-caused methane emissions may need to be supplemented with methane removal approaches.”
Dr Mark Lunt – a postdoctoral research associate at the University of Edinburgh’s school of geosciences, who was not involved in the research – warns Carbon Brief that “committed emissions from a wetland-climate methane feedback have the potential to offset any reductions made through agreements like the Global Methane Pledge”.
Allen says that further measurements and modelling are “urgently required” in order to “fully characterise this worrying trend”.
Source or sink?
Methane is not the only greenhouse gas released from wetlands. They are also sources of carbon dioxide and nitrous oxide.
A separate Nature Climate Change study uses observations from 167 sites to assess how global warming will impact wetland emissions of all three gases.
The authors find that although wetlands are currently a sink of greenhouse gases, the “100-year global warming potential of wetlands” could rise by 57% under a global temperature increase of 1.5-2C.
The authors find that greenhouse gas emissions from wetlands depend in part on the type of plant found in the wetland. They focus on vascular plants – a group of plants including conifers and flowering plants that have tubes called the “xylem” and “phloem” to transport food and water internally – and cryptogram plants that reproduce using spores, such as algae.
Dr Xiyan Xu – a researcher at China’s Institute of Atmospheric Physics and author on the study – explains the main findings of the study to Carbon Brief:
“Although warming increases the CO2 sink of wetlands dominated by vascular plants, it enhances CO2 source in cryptogam-dominated wetlands much more remarkably. As a net source of methane and nitrous oxide, the wetlands show a positive response to warming, especially in permafrost wetlands dominated by vascular plants.”
The study warns that “warming undermines the mitigation potential of pristine wetlands”, adding that there is “major uncertainty” over whether or not wetlands will remain a carbon sink as the planet warms.
Dreyfus tells Carbon Brief that this study is a “nice complement” to the first one, adding that it “elegantly synthesises data from higher latitude northern hemisphere wetland sites to show a more complex picture”.
Poulter adds that this paper “provides support” that observed warming is “a culprit in the rapid increase in atmospheric methane over the past decade”.
About the Author: CLIMATE STATE
POPULAR
COMMENTS
- The risk with the path to a hothouse Earth | Climate State on Climate Tipping Points Existential Threat to Our Life Support Systems
- Robert Schreib on Electricity generation prices may increase by as much as 50% if only based on coal and gas
- Robert Schreib on China made a historic commitment to reduce its emissions of greenhouse gases
- Lee Nikki on COP30: Climate Summit 2025 – Intro Climate Action Event
- Hollie Bailey on Leaders doubled down on fossil fuels after promising to reduce climate pollution