2013 Is the Fourth Hottest Year on Record
Slate: It’s official: 2013 is the fourth hottest year since records started being kept in 1880. It ties with 2003 for that dubious honor.
This result was just announced by the National Oceanic and Atmospheric Administration. It uses global annual land and sea surface temperatures to make the call, and in 2013 these two measures combined for a temperature 0.62 C (1.12 F) above the 20th century average of 13.9 C (57.0 F).
Were you born after 1976? Then you’ve never experienced an average year: 2013 isthe 37th year in a row with temperatures above the 20th century average.
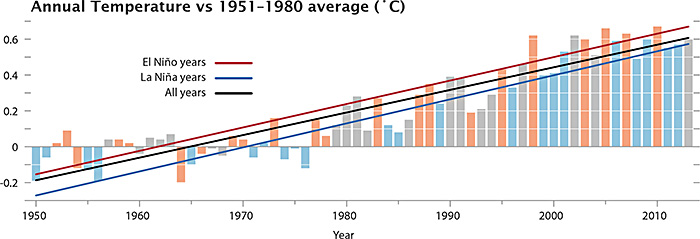
The report also states that nine of the 10 hottest years on record have been in the 21stcentury (2010 is the record holder for hottest year ever). Only one year from the 20thcentury is on that list, 1998, and that’s about as late in the century as you can get. Not so incidentally, 1998 was an El Niño year; those years tend to have higher surface temperatures overall. 2013 was not an El Niño year; 1998 being warmer than 2013 is no cause for celebration.

NOAA: 2013 Was Tied For The Fourth-Hottest Year On Record
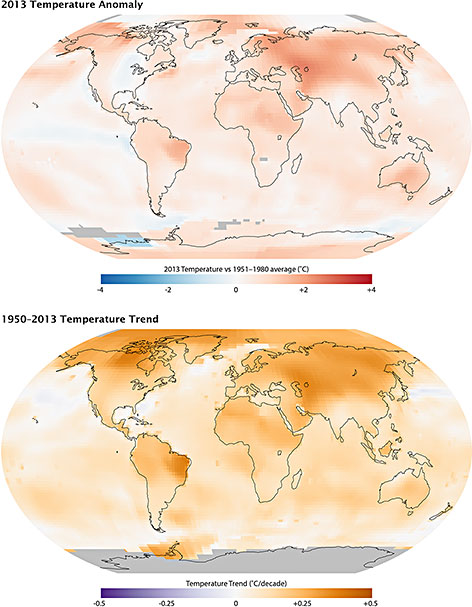
ClimateProgress: The National Oceanic and Atmospheric Administration (NOAA) reported Tuesday that 2013 was tied with 2003 as the fourth-warmest year since records began in 1880 — annual land and ocean surface temperatures were 0.62°C (1.12°F) higher than average. The National Aeronautics and Space Administration (NASA) reported that along with 2009 and 2006, 2013 was tied for the seventh-warmest year on record, “continuing a long-term trend of rising global temperatures.” NASA used essentially the same data — it just processes it slightly differently than NOAA does. Indeed, the difference between 4th place and 7th place is just two-hundredths of a degree. NASA had the “temperature anomaly” — how much the global temperature deviated from the average — pegged at 0.60°C and NOAA had 0.58°C.
The data from 2013 is just one report, but it is another data point in a trend that people can expect as the atmosphere gets more and more filled with increasing amounts of heat-trapping greenhouse gases. Gavin Schmidt, Deputy Chief at NASA GISS, told reporters on a conference call Tuesday that “long-term trends in climate are extremely robust — there is year-to-year variability, there is season-to-season variability, there are times such as today, when we can have snow, even in a globally warmed world.”

NASA Finds 2013 Sustained Long-Term Climate Warming Trend Source
NASA scientists say 2013 tied with 2009 and 2006 for the seventh warmest year since 1880, continuing a long-term trend of rising global temperatures.
With the exception of 1998, the 10 warmest years in the 134-year record all have occurred since 2000, with 2010 and 2005 ranking as the warmest years on record.
NASA’s Goddard Institute for Space Studies (GISS) in New York, which analyzes global surface temperatures on an ongoing basis, released an updated report Tuesday on temperatures around the globe in 2013. The comparison shows how Earth continues to experience temperatures warmer than those measured several decades ago.
The average temperature in 2013 was 58.3 degrees Fahrenheit (14.6 degrees Celsius), which is 1.1 °F (0.6 °C) warmer than the mid-20th century baseline. The average global temperature has risen about 1.4 °F (0.8 °C) since 1880, according to the new analysis. Exact rankings for individual years are sensitive to data inputs and analysis methods.
“Long-term trends in surface temperatures are unusual and 2013 adds to the evidence for ongoing climate change,” GISS climatologist Gavin Schmidt said. “While one year or one season can be affected by random weather events, this analysis shows the necessity for continued, long-term monitoring.”
Scientists emphasize that weather patterns always will cause fluctuations in average temperatures from year to year, but the continued increases in greenhouse gas levels in Earth’s atmosphere are driving a long-term rise in global temperatures. Each successive year will not necessarily be warmer than the year before, but with the current level of greenhouse gas emissions, scientists expect each successive decade to be warmer than the previous.
Carbon dioxide is a greenhouse gas that traps heat and plays a major role in controlling changes to Earth’s climate. It occurs naturally and also is emitted by the burning of fossil fuels for energy. Driven by increasing man-made emissions, the level of carbon dioxide in Earth’s atmosphere presently is higher than at any time in the last 800,000 years.

Chart of the temperature anomalies for 1950-2013, also showing the phase of the El Niño-La Niña cycle. (Image Credit: NASA/GSFC/Earth Observatory, NASA/GISS)
The carbon dioxide level in the atmosphere was about 285 parts per million in 1880, the first year in the GISS temperature record. By 1960, the atmospheric carbon dioxide concentration, measured at the National Oceanic and Atmospheric Administration’s (NOAA) Mauna Loa Observatory in Hawaii, was about 315 parts per million. This measurement peaked last year at more than 400 parts per million.
While the world experienced relatively warm temperatures in 2013, the continental United States experienced the 42nd warmest year on record, according to GISS analysis. For some other countries, such as Australia, 2013 was the hottest year on record.
The temperature analysis produced at GISS is compiled from weather data from more than 1,000 meteorological stations around the world, satellite observations of sea-surface temperature, and Antarctic research station measurements, taking into account station history and urban heat island effects. Software is used to calculate the difference between surface temperature in a given month and the average temperature for the same place from 1951 to 1980. This three-decade period functions as a baseline for the analysis. It has been 38 years since the recording of a year of cooler than average temperatures.
The GISS temperature record is one of several global temperature analyses, along with those produced by the Met Office Hadley Centre in the United Kingdom and NOAA’s National Climatic Data Center in Asheville, N.C. These three primary records use slightly different methods, but overall, their trends show close agreement.
Related
- NASA Earth Observatory has posted a somewhat different temperature summation at: earthobservatory.nasa.gov/IOTD/view.php?id=82918
- Additional commentary on the 2013 temperature anomaly is provided by Dr. James Hansen of Columbia University at: http://www.columbia.edu/~jeh1/mailings/2014/20140121_Temperature2013.pdf
- The GISTEMP analysis website is located at: data.giss.nasa.gov/gistemp/
- For additional press briefing images related to the data, visit: go.nasa.gov/1ekwJaf
- For more information about Earth science at NASA, visit: http://www.nasa.gov/earth
About the Author: CLIMATE STATE
POPULAR
COMMENTS
- Robert Schreib on Electricity generation prices may increase by as much as 50% if only based on coal and gas
- Robert Schreib on China made a historic commitment to reduce its emissions of greenhouse gases
- Lee Nikki on COP30: Climate Summit 2025 – Intro Climate Action Event
- Hollie Bailey on Leaders doubled down on fossil fuels after promising to reduce climate pollution
- Malcolm R Forster on Mythbusters tests global warming theory – does CO2 warm air?
Muy preocupante… y a muchos… no les importa.
Don’t look now. A train is coming and humanity has tied itself to the
tracks.
You look at this evidence in an easy to digest visual format, then look
towards our initiatives towards dealing with global warming, and something
doesn’t match.
SHHHEEEEEEEEEEEEEEEEEEEEEEEEEEEEEEEEEEEIIIIIIIIIIIIIIIIIIIIIIIITT !!!!
But what Nasa isn’t telling you is that the record start since 2012.lol
They need to make the color not yellow, but red with fire shooting out the
sides of Australia and Canada-.and a huge mushroom cloud coming from the
north pole!! That would really prove there is global warming much better.