Extensive ice in Antarctica

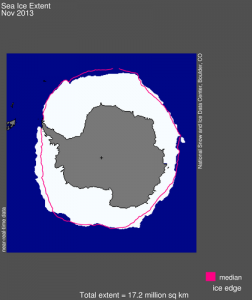
Antarctic sea ice extent for November 2013 was 17.2 million square kilometers (6.63 million square miles). The magenta line shows the 1981 to 2010 median extent for that month. The black cross indicates the geographic South Pole. Sea Ice Index data. About the data Credit: National Snow and Ice Data Center
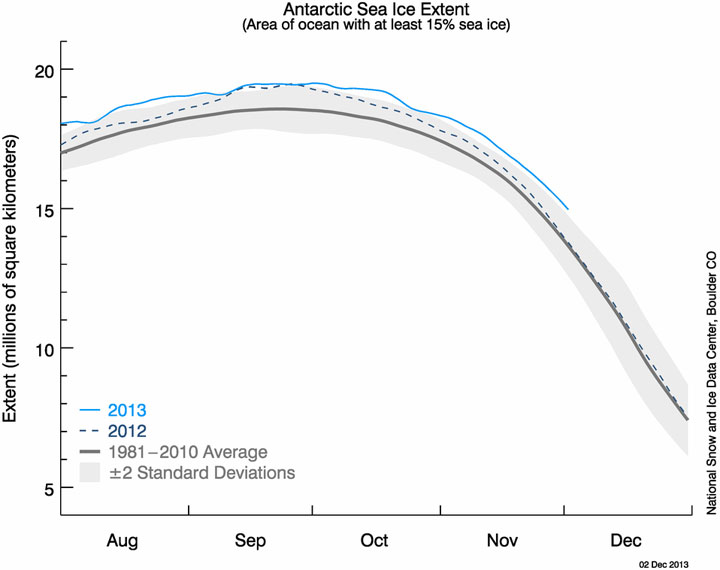
National Snow and Ice Data Center: While it is early winter in the Arctic, it is early summer in the Antarctic. Continuing patterns seen in recent years, Antarctic sea ice extent remains unusually high, near or above previous daily maximum values for each day in November.
Sea ice is anomalously extensive across the Peninsula, the Amundsen Sea, and the Wilkes Land sectors. However, it has retreated in the northern Ross Sea region—where it had been far to the north of the mean ice edge—to more typical extent locations.
Sea ice extent averaged 17.16 million square kilometers (6.63 million square miles) for November. The long-term 1981 to 2010 average extent for this month is 16.30 million square kilometers (6.29 million square miles).
Beginning in October, wind conditions in the Ross Sea shifted from a direction favoring a northward growth of sea ice to a more westerly direction. This and the coming of sunshine and warmth with spring led to a retreat from record ice extents there.
However, November brought cool conditions (1 to 3 degrees Celsius, or 2 to 5 degrees Fahrenheit, below the 1981 to 2010 average) around the Peninsula and much of the western hemisphere of the Southern Ocean.
Winds have also favored a northward drift along the western Peninsula. Overall, cool conditions and extensive ice around the Peninsula strongly contrast with the past few decades’ shift to a more ice free Peninsula and extensive surface melting there.
Palmer Station, the U.S. Antarctic research base, was once again briefly surrounded by sea ice this winter, as it was in 2012. Overall, the extreme sea ice extent may be linked to strong variations in the westerly wind flow, the main circulation around Antarctica.
Strong westerly flow favors ice growth in autumn and early winter, and this was the case; however, as sea ice approached a maximum, the westerly wind pattern abated, allowing ice to drift even further north than usual, in some places urged on by southerly winds.
At the same time, part of the interior has seen record warm winter events, with several daily temperature records set at the South Pole . These warm events are also linked to the reduction in westerly wind strength in August to October.
Weaker westerly winds allow more north-south flow into Antarctica, occasionally bringing relatively warm air masses into the interior. Between September 11 and September 15, usually a time of unimaginable cold, four daily maximum temperature records were set, in one case by more than 8.5 degrees Celsius (15.3 degrees Fahrenheit).
On September 13, the temperature reached –27.7 degrees Celsius (–17.9 degrees Fahrenheit), a temperature more typical of early summer conditions.
Related
About the Author: CLIMATE STATE
POPULAR
COMMENTS
- The risk with the path to a hothouse Earth | Climate State on Climate Tipping Points Existential Threat to Our Life Support Systems
- Robert Schreib on Electricity generation prices may increase by as much as 50% if only based on coal and gas
- Robert Schreib on China made a historic commitment to reduce its emissions of greenhouse gases
- Lee Nikki on COP30: Climate Summit 2025 – Intro Climate Action Event
- Hollie Bailey on Leaders doubled down on fossil fuels after promising to reduce climate pollution

[…] Extensive ice in Antarctica […]
[…] Extensive ice in Antarctica […]