2013 was hottest year on record in Australia
Australia has just sweltered through its hottest year on record, according to the Bureau of Meteorology. Average temperatures were 1.20 degrees Celsius above the long-term average of 21.8C, breaking the previous record set in 2005 by 0.17C.
Professor Karoly: “In the model experiments, it is not possible to reach such a temperature record due to natural climate variations alone”
“While many climate extremes cannot be directly attributed to a changing climate, the burden of extremes Australia is experiencing is a product of climate change and requires a coordinated national response.”
The 2013 record high is also remarkable because it occurred not in an El Nino year (where a warm ocean current can push up temperatures), but a normal year.
Annual climate statement 2013
Data collected and analysed by the Bureau of Meteorology show that 2013 was Australia’s warmest year on record while rainfall was slightly below average nationally.
- Summer 2012–13 was the warmest on record nationally, spring was also the warmest on record and winter the third warmest
- Overall, 2013 was Australia’s warmest year on record: annual national mean temperature was +1.20 °C above average
- All States and the Northern Territory ranked in the four warmest years on record
- Nationally-averaged rainfall was slightly below average for the year, with 428 mm (1961–1990 average 465 mm)
- Rainfall was mostly below average for the inland east and centre, and above average for the east coast, northern Tasmania and parts of Western Australia
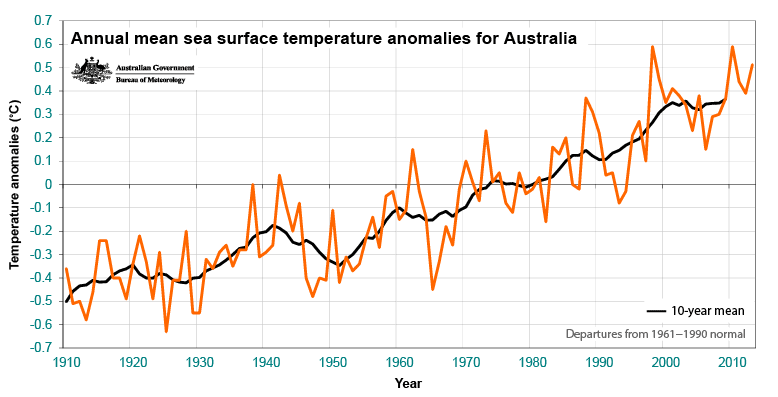
The black line shows the 10-year moving average.
URL http://www.bom.gov.au/climate/current/annual/aus/2013/
Australia records its warmest spring: The spring of 2013 has been Australia’s warmest on record. Mean temperatures for the season were 1.57C above the 1961-1990 average, surpassing the previous record of 1.43C (set in 2006) by 0.14C. Daytime maximum temperatures were also the highest on record, coming in 2.07C above average and 0.24C above the previous record (also set in 2006), while overnight minimum temperatures were the fourth-warmest on record.
The warmth was most dramatic in September, which saw a mean temperature anomaly of +2.75C, setting a new monthly record by more than a degree. October was also a very warm month, 1.43C above average.
Heatwave expected to hit one-third of Australia over Christmas – This is the first protracted heatwave of the spring-summer period over such a large area.
Related
- Australia record-breaking heat wave bushfires rage as temperatures hit 54C
- Australia Rings In The New Year With Record-Breaking Heat Wave
- Australian heatwave: Bushfires rage as temperatures hit 54
- Tony Abbott’s new year’s resolution: disavow climate change extremist Maurice Newman
2013 Heat waves exacerbated by climate change
About the Author: CLIMATE STATE
POPULAR
COMMENTS
- The risk with the path to a hothouse Earth | Climate State on Climate Tipping Points Existential Threat to Our Life Support Systems
- Robert Schreib on Electricity generation prices may increase by as much as 50% if only based on coal and gas
- Robert Schreib on China made a historic commitment to reduce its emissions of greenhouse gases
- Lee Nikki on COP30: Climate Summit 2025 – Intro Climate Action Event
- Hollie Bailey on Leaders doubled down on fossil fuels after promising to reduce climate pollution
Australia Govt BOM Annual climate statement 2013 – Issued Friday 3 January 2014
National mean temperature was +1.2 °C above the 1961–1990 average
2013 was Australia’s warmest year on record, since national records began in 1910
Summer 2012–13 (Dec-Feb) was the warmest on record
Spring 2013 (Sept-Nov) was the warmest on record
Winter 2013 (Jun-Aug) was the third warmest
Maximum temperatures were +1.45 °C above average
Minimum temperatures +0.94 °C above average
ENSO 2013 was a NEUTRAL year for the El Niño–Southern Oscillation
Neither El Niño or La Niña influenced Australian rainfall
Temperatures were generally slightly below normal in the eastern equatorial Pacific
Remained within neutral thresholds for the entire 12 months
Sea Surface Temperatures (SSTs) around Australia were unusually warm throughout the year
Monthly anomalies for January and February the highest on record
For November the second-highest on record.
This extends a period of sustained record-high SSTs in the Australian region since 2010.
SSTs Year to November are +0.51 °C above the long-term average, third-highest since 1910
Annual mean temperature was +0.17 °C above the previous record set in 2005 (+1.03 °C)
Warmest year on record for South Australia, Western Australia and the Northern Territory
In South Australia mean temperatures were 0.41 °C above the previous record set in 2009
All other States ranked in the top four years: Queensland and New South Wales second,
Victoria third and Tasmania fourth highest average temperatures since 1910 records began.
http://www.bom.gov.au/climate/current/annual/aus/2013/
So when ENSO switches back to a ‘warming trend’, a ‘drought trend’ – what could happen in Australia?
A very good point and a fresh article from Business Insider is covering it.
“While many climate extremes cannot be directly attributed to a changing climate, the burden of extremes Australia is experiencing is a product of climate change and requires a coordinated national response.”
The 2013 record high is also remarkable because it occurred not in an El Nino year (where a warm ocean current can push up temperatures), but a normal year.
Professor David Karoly, from the School of Earth Sciences at University of Melbourne, says analysis has been made of the temperature record using simulations with nine different climate models that represent the natural variability of Australian average temperatures.
He says these indicate that greenhouse climate change vastly increased the odds of setting a new temperature record.
“In the model experiments, it is not possible to reach such a temperature record due to natural climate variations alone,” Professor Karoly says.
In simulations with no increases in greenhouse gases, none of the more than 13,000 model years analysed reach the record temperature observed in 2013.
And in simulations for 2006 to 2020 with natural variability and human influences, including increases in greenhouse gases, such records occur approximately once in every ten years.
“Hence, this record could not occur due to natural variability alone and is only possible due to the combination of greenhouse climate change and natural variability on Australian average temperature.” http://www.businessinsider.com.au/more-extremes-of-heat-wind-floods-bushfires-on-the-agenda-after-australias-hottest-year-2014-1#social
‘the world is cooling for 18 years now’ the retarded idiot deniers say. lol
They will have to lean the hard way that the majority of scientists are
right. My daughters kids will pay the price of our generation folly.
With heat like this in Australia it is making me wonder what the melt
conditions are in Antarctica?
6 January 2014, Australia’s hottest year was no freak event: HUMANS CAUSED IT
by Professor of Atmospheric Science David Karoly & Research Fellow Sophie Lewis at the University of Melbourne.
“Using the climate models, the Fraction of Attributable Risk (FAR) shows how much the risk of extreme temperatures increases thanks to human influences.
In our earlier study of our record hot Australian summer of 2012-13, we found that it was very likely (with 90% confidence) that human influences increased the odds of extreme summers such as 2012-13 by at least five times.
In August 2013, Australia broke the record for the hottest 12-month period. The odds of this occurring increased again from the hottest summer. We found that human influence increased the odds of setting this new record by at least 100 times.”
https://theconversation.com/australias-hottest-year-was-no-freak-event-humans-caused-it-21734
“Probabilities of annual average temperatures for Australia from climate model simulations including natural influences only (green) and both natural and human climate influences (red) for model years 2006-2020. The vertical lines show the temperature anomalies observed in 2013 and in 2005 (the previous hottest year observed). David Karoly & Sophie Lewis”
2 September 2013, Hottest 12-month period confirmed – so what role did humans play?
“It’s official, the past 12 months have been the hottest in Australia for more than a hundred years. Temperatures averaged across Australia between September 2012 and August 2013 were hotter than any year since good records began in 1910. The previous record was held by the 12-month period from February 2005 to January 2006.
The new record follows a suite of broken records following last year’s “angry summer”, including the hottest summer since records began.”
https://theconversation.com/hottest-12-month-period-confirmed-so-what-role-did-humans-play-17737
Extreme Weather directory artciles – Analysis and Comment (16) Research and News (7)
https://theconversation.com/topics/extreme-weather
WMO Reports Most extreme weather decade in History – 2001 to 2010 Warmest on Record – Wettest since 1901 – Floods were the most common extreme weather event
See: http://climatestate.com/2013/07/07/signs-of-change-the-past-week-or-so-july-2013/
—
MUST SEE 2013 VIDEO SUMMARY 18:39 minutes
SOC – Epic Extreme Events Of Earth 2013 Review Mass Media Reports
Published on Jan 5, 2014 http://youtu.be/0iZGVUa0BFo
Warning: This video may be too intense and dramatic for some viewers to handle. Viewer discretion is advised!
*This series does not mean the world is ending! These are documentaries of series of extreme weather events that are leading to bigger earth changes. If you are following the series, then you’re seeing the signs.
Hawkkey Davis Channel – SOC Signs of Change are Everywhere
http://www.youtube.com/user/HawkkeyDavisChannel
—
BUSHFIRES AUSTRALIA 2013
January 5 2013 7News : Weekend Bushfires South Australia, Tasmania, NSW http://www.youtube.com/watch?v=5qJL7f8T6NY
Jan 5, 2013 7News : Tasmania devastated by bushfires – At least 90 homes have been destroyed during the Tasmanian bushfires, fears of one death, and a further threat to life and property. http://www.youtube.com/watch?v=Qxz9x7HYIHo
Jan 14, 2013 Australian Bushfires in photos http://www.youtube.com/watch?v=V83LzvXQDTE
Australian Spring Bushfires
Australia Bushfire 2013: NASA Aqua satellite show the scale of the bushfires around Sydney http://www.youtube.com/watch?v=VEYwsJ0tJ-U
Sep 10, 2013 An investigation is underway into the cause of yesterday’s bush fires in Sydney’s western suburbs and Blue Mountains. A bushfire emergency was declared in a number of areas across NSW, these included Marsden Park, the Hawkesbury, Londonderry and Winmalee. http://www.youtube.com/watch?v=rNpmmneTjLA
Oct 13, 2013 Australian heatwave sparks fires in Sydney – Emergency crews battle fires across the Australian state of New South Wales, amid high temperatures and strong winds. http://www.youtube.com/watch?v=TU5RL6rVxZ0
Oct 17, 2013 Sunrise : Large fires burning in NSW http://www.youtube.com/watch?v=22Kil_bkQCM
Oct 18, 2013 Today Tonight : NSW bushfire crisis http://www.youtube.com/watch?v=kLTH_JsoSts
Oct 18, 2013 ITN Australia bushfires: Firefighters face 30m high flames in Lake Macquarie http://www.youtube.com/watch?v=GZv-PN63MwE
Winmalee bushfire – the day after raw footage http://www.youtube.com/watch?v=5UY4YqJX6TQ
Oct 20, 2013 7News : UNPARALLELED Emergency – 30 Day State of Emergency has been declared in NSW with the state experiencing its worst bushfire crisis in 45 years. 200,000 Hectares already destroyed by Fire. http://www.youtube.com/watch?v=8aojpiGChQw & http://www.youtube.com/watch?v=bVn14ZYzboo
Oct 21, 2013 7News : ‘Never seen anything like it’ in Blackheath Mt Victoria – Captain Jim Crowther has been a volunteer firie in the mountains for exactly 50 years – he has never seen anything like this before.
Oct 21, 2013 CNN Terrifying fire conditions in Australia http://www.youtube.com/watch?v=103GPbmJhJI
Oct 21, 2013 Threat Of ‘Mega Fire’ : Volunteer RFS firefighter speaks about current danger – As New South Wales faces the threat of a “mega-fire” a volunteer firefighter talks movingly of the fear and camaraderie he’s seen. http://www.youtube.com/watch?v=eDfPmSrw3dg
Oct 22, 2013 CNN Winds and temperatures picking up http://www.youtube.com/watch?v=39BZ8Zpz7hk
3 November 2013 Firefighters raced to contain a raging bush fire in Australia on Sunday as authorities issued an emergency warning for people to leave the area. http://www.youtube.com/watch?v=ukZFw5oOQKA
Nov 8, 2013 – Firefighters battle bushfires threatening homes in north-west Sydney http://www.youtube.com/watch?v=B8sjChgBHaQ
More background info on Extreme Weather Events and Unprecedented Effects
2013 AR5 WGI Science Summary for Policy Makers says:
“…it is now *very likely* that anthropogenic (human activity / influence) forcing has
contributed to the observed changes in the frequency and intensity of daily
temperature extremes on the global scale since the mid-20th century. It is *likely*
that human influence has *significantly increased* the probability of occurrence of
heat waves in some locations…”
“Since the AR4 (2007), there is some *new limited direct evidence* for an
anthropogenic (man made/human activity) influence on extreme precipitation, including
a formal detection and attribution study and indirect evidence that extreme
precipitation would be expected to have increased given the evidence of anthropogenic
influence on various aspects of the global hydrological cycle and *high confidence*
that the *intensity of extreme precipitation events* will increase with warming, at a
rate well exceeding that of the mean precipitation (ie expotentially).
In land regions where observational coverage is sufficient for assessment, there is
*medium confidence* that anthropogenic (human) forcing (heat effect) has contributed
to a global-scale *intensification* of heavy precipitation over the second half of the
20th century.”
The SPM also highlights the following:
It is now considered even more certain (> 95%) that human influence has been the
dominant cause of the observed warming since the mid-20th century. Natural internal
variability and natural external forcings (eg the sun) have contributed virtually
nothing to the warming since 1950 – the share of these factors was narrowed down by
IPCC to ± 0.1 degrees. The measured temperature evolution is shown in the following
graph. http://www.scilogs.de/wblogs/gallery/16/AR5_temp_obs.png
It is extremely likely that more than half of the observed increase in global average
surface temperature from 1951 to 2010 was caused by the anthropogenic increase in
greenhouse gas concentrations and other anthropogenic forcings together. The best
estimate of the human-induced contribution to warming is similar to the observed
warming over this period.
Warming of the climate system is unequivocal, and since the 1950s, many of the
observed changes are unprecedented over decades to millennia. The atmosphere and ocean have warmed, the amounts of snow and ice have diminished, sea level has risen, and the concentrations of greenhouse gases have increased (see Figures SPM.1, SPM.2, SPM.3 and SPM.4). {2.2, 2.4, 3.2, 3.7, 4.2–4.7, 5.2, 5.3, 5.5–5.6, 6.2, 13.2}
Each of the last three decades has been successively warmer at the Earth’s surface
than any preceding decade since 1850 (see Figure SPM.1). In the Northern Hemisphere,
1983–2012 was likely the warmest 30-year period of the last 1400 years (medium
confidence). {2.4, 5.3}
IPCC References: WGI Summary for Policy Makers http://www.climatechange2013.org/images/uploads/WGI_AR5_SPM_brochure.pdf
Michael Mann: Climate-Change Deniers Must Stop Distorting the Evidence (Op-Ed)
Michael Mann, Penn State University | September 26, 2013
http://www.livescience.com/39957-climate-change-deniers-must-stop-distorting-the-evidence.html
Oct 2013 – Extreme Weather Events In Europe: Preparing For Climate Change Adaptation
EASAC was formed by the national science academies of the European Union (EU) Member
States to enable them to collaborate with each other and speak with one voice with the
aim of building science into policy at the EU level.
Its mission reflects the view of academies that science is central to many aspects of
modern life and that an appreciation of the scientific dimension is a pre-requisite to
wise policy-making.
Its views are vigorously independent of commercial or political bias, and it
is open and transparent in its processes. EASAC aims to deliver advice that is
comprehensible, relevant and timely.
http://thegenerator.com.au/extreme-weather-events-in-europe-preparing-for-climate-
change-adaptation/
2013 Au Gov – Climate Adaptation Outlook: A Proposed National Adaptation Assessment
Framework
http://www.climatechange.gov.au/sites/climatechange/files/documents/06_2013/climate-
adaptation-outlook.pdf
May 2012 – http://www.macfound.org/media/article_pdfs/The_State_of_Adaptation_in_the_United_State
s.pdf
2011 US NAVY
Climate change is a national security challenge with strategic implications for the
Navy.
https://www.facebook.com/NavyTFCC
http://www.navy.mil/navydata/documents/CCR.pdf
clearly the trillions and trillions of tons of CO2 and multitude of noxious
chemicals that humans are discharging into the atmosphere every day – and
have been doing so for decades – could not possibly have any effect on the
atmosphere whatesoever or impact the climate in any way at all. i mean what
kind of logic is that? that’s just so absurd! of course we have to continue
to allow the oil industry to maintain it’s totalitarian monopoly over the
energy sector and help them maintain their ‘corporate science’ that
educates us on the real truth about how climate change is just a giant
scam. how else can they be expected to preserve their modest profits? i’m
so relieved that the conservatives especially understand this more than
anyone, thanks to their friendly ties with the industry. although that
should come as no surpirse, since they know their science so well as to
recognize that the earth is only 4000 years old.
[…] 2013 was hottest year on record in Australia […]
The Earth has been rebounding out of the little ice age for 300 years –
there is no proof that the rate of warming is out of normal variability,
all the proof is that we are warming within the bounds of normal
variability. 1700- to 1735 warmed at a much faster rate than anything today
with all of our carbon dioxide. Solar cycles drive earths temperature-
carbon dioxide is a minor insignificant factor. Go investigate the facts.