Arctic Sea Ice Spiral (2013)
Published On: August 14, 2013
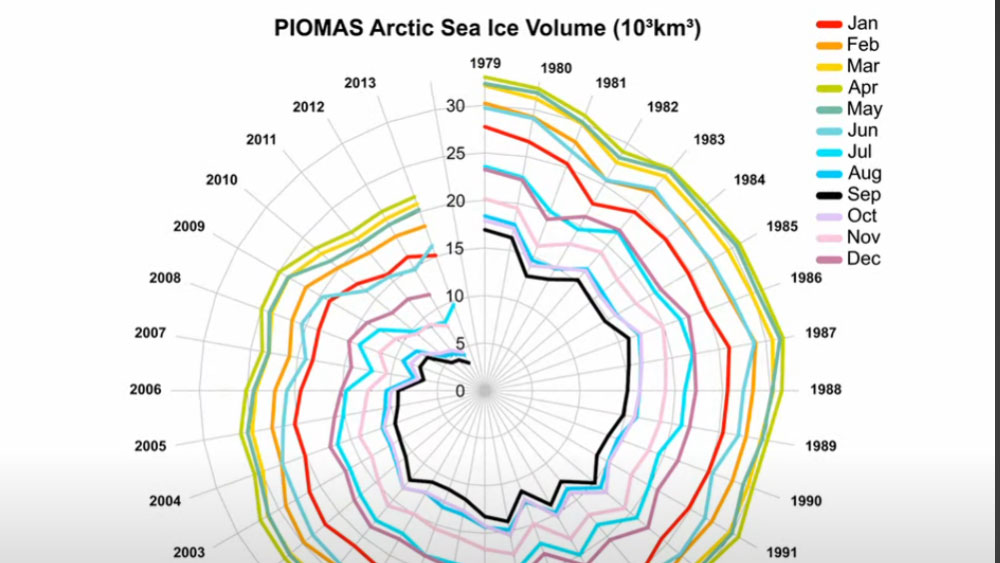
Visualization of Arctic sea ice volume, showing the evolution of sea-ice over time from 1979 to July 2013.
Pitch of the notes are proportional to the average sea-ice volume for each month.
About the data: Sea Ice Volume is calculated using the Pan-Arctic Ice Ocean Modeling and Assimilation System (PIOMAS, Zhang and Rothrock, 2003) developed at APL/PSC.
Source data for this graph is available from http://psc.apl.washington.edu
About the Author: Andy Lee Robinson
Subscribe
Login
0 Comments
Oldest
Newest
Inline Feedbacks
View all comments