Arctic Death Spiral 1979-2013 ( Sea Ice Decline / Deglaciation)

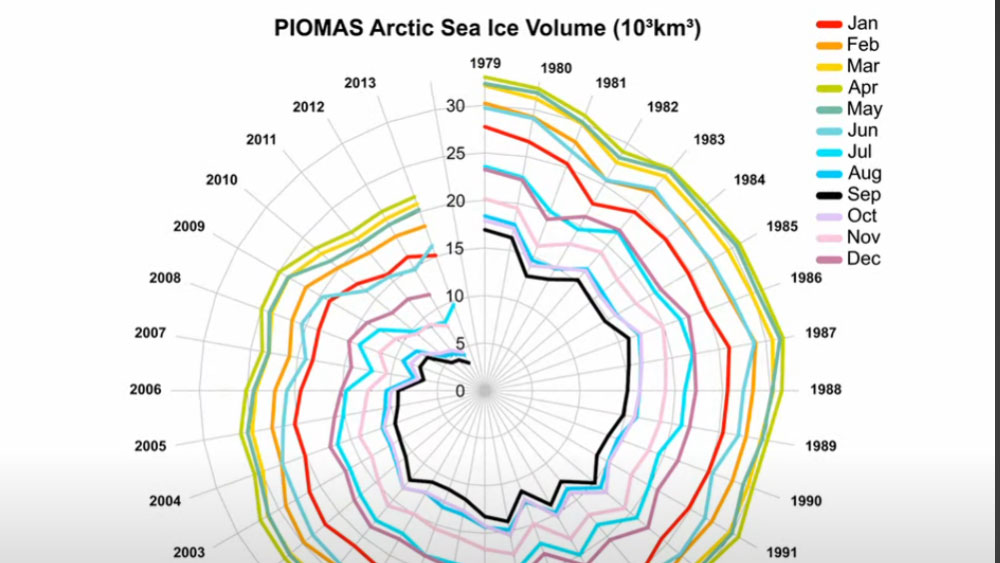
Monthly averages from January 1979 – 2014 (Jan). Data source via the Polar Science Center (University of Washington) URL.  Data visualisation by Andy Lee Robinson.   Arctic Death Spiral by Andy Lee Robinson is licensed under a Creative Commons Attribution-ShareAlike 4.0 International License. Based on a work at http://haveland.com/share/arctic-death-spiral.png. Permissions beyond the scope of this license may…

Arctic Sea Ice Minimum Volumes 1979-2013

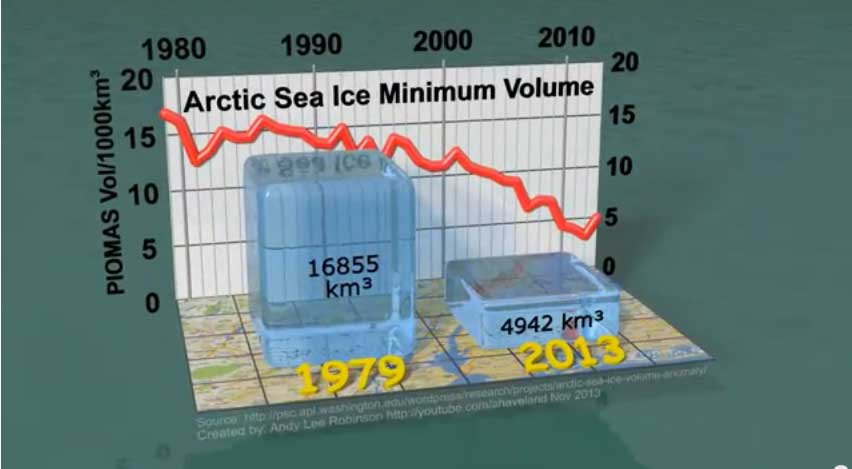
Published on YouTube Nov 21, 2013: This is an animated visualization of the startling decline of Arctic Sea Ice, showing the minimum volume reached every September since 1979, set on a map of New York with a 10km grid to give an idea of scale. It is clear that the trend of Arctic sea ice…

Arctic Death Spiral – Evolution to July 2013

Published on YouTube Aug 12, 2013: This is a visualization of the Arctic Death Spiral showing the evolution of the volume of sea-ice over time from 1979 to July 2013. Pitch of the notes are proportional to the average sea-ice volume for each month. Spectral filters are derived from the average sea-ice volume for each…