Skip to content
Search for:
Register
Login
News
Videos
Sea Level Rise
Publish
Donate
Patreon
YouTube
Toggle Navigation
News
Videos
Sea Level Rise
Publish
Donate
Patreon
YouTube
Search for:
Trends in Hurricane Activity (2018)
Published On: July 10, 2018
Expert: Global Warming made Hurricane Harvey Stronger
Published On: September 1, 2017
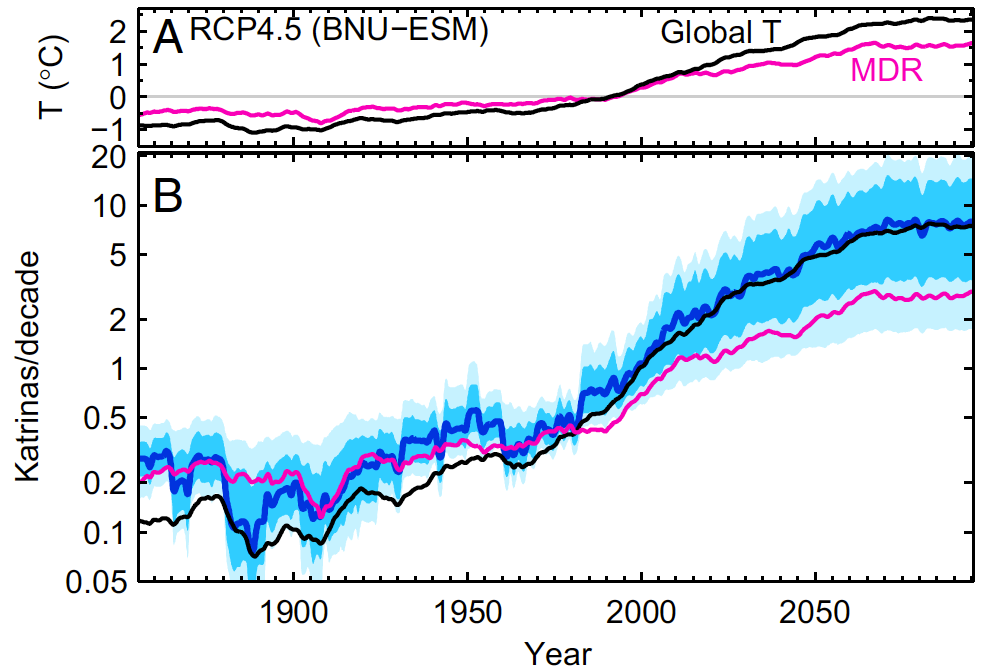
Study: More Strong Hurricanes
Published On: May 30, 2013
Our Angry Earth by Isaac Asimov and Frederik Pohl
Published On: May 2, 2013
Page load link
Go to Top