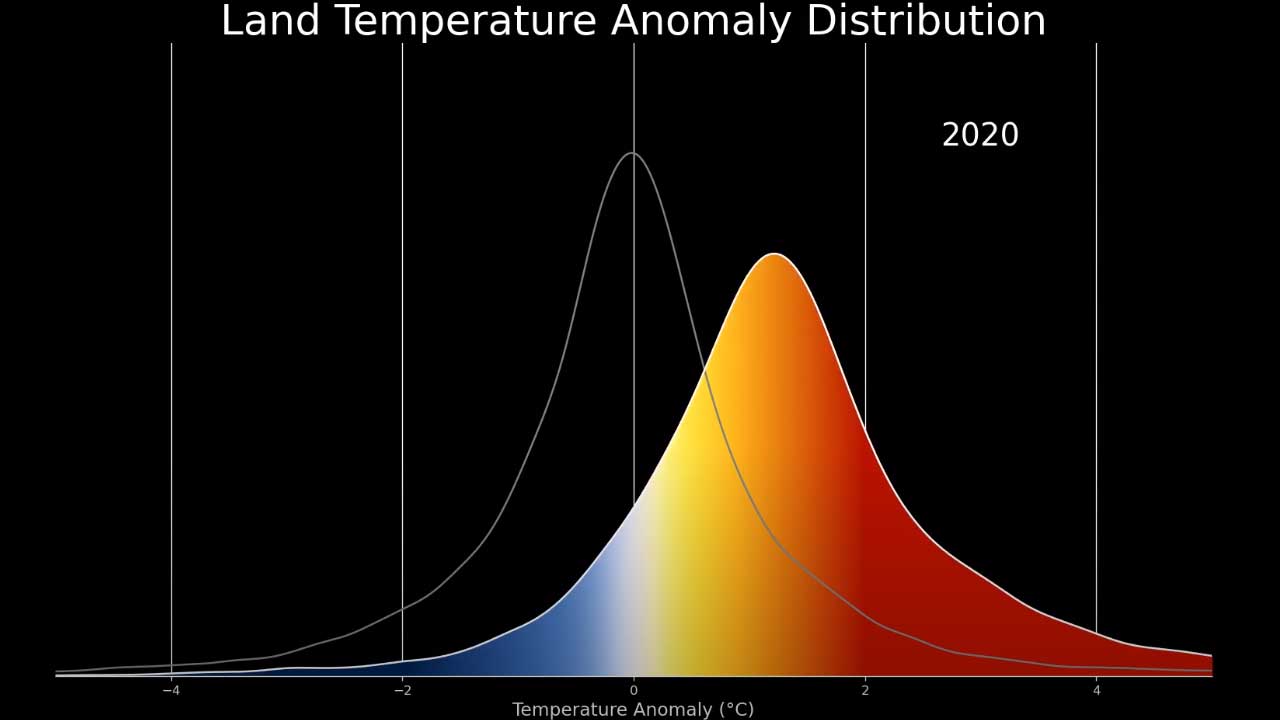
NASA: The Land Temperature Bell Curve Heat Up (1950-2020)
This visualization shows that as land temperatures have increased since 1950, hotter days have become more common and colder days have become less common.
When the bell curve becomes shorter, one can see more data trending toward the right, revealing hotter days.
NASA: This visualization shows how the distribution of land temperature anomalies has varied over time. As the planet has warmed, we see the peak of the distribution shifting to the right. The distribution of temperatures broadens as well. This broadening is most likely due to differential regional warming rather than increased temperature variability at any given location.
These distributions are calculated from the Goddard Institute of Space Studies GISTEMP surface temperature analysis. Distributions are determined for each year using a kernal density estimator, and we morph between those distributions in the animation.
NASA’s full surface temperature data set – and the complete methodology used to make the temperature calculation – are available at: https://data.giss.nasa.gov/gistemp
