Ice sheet deglaciation and methane emissions, with the scope on Greenland’s melt season
On June 9 2016, Nuuk, the capital of Greenland, reached […]
Date Posted:
July 21, 2016
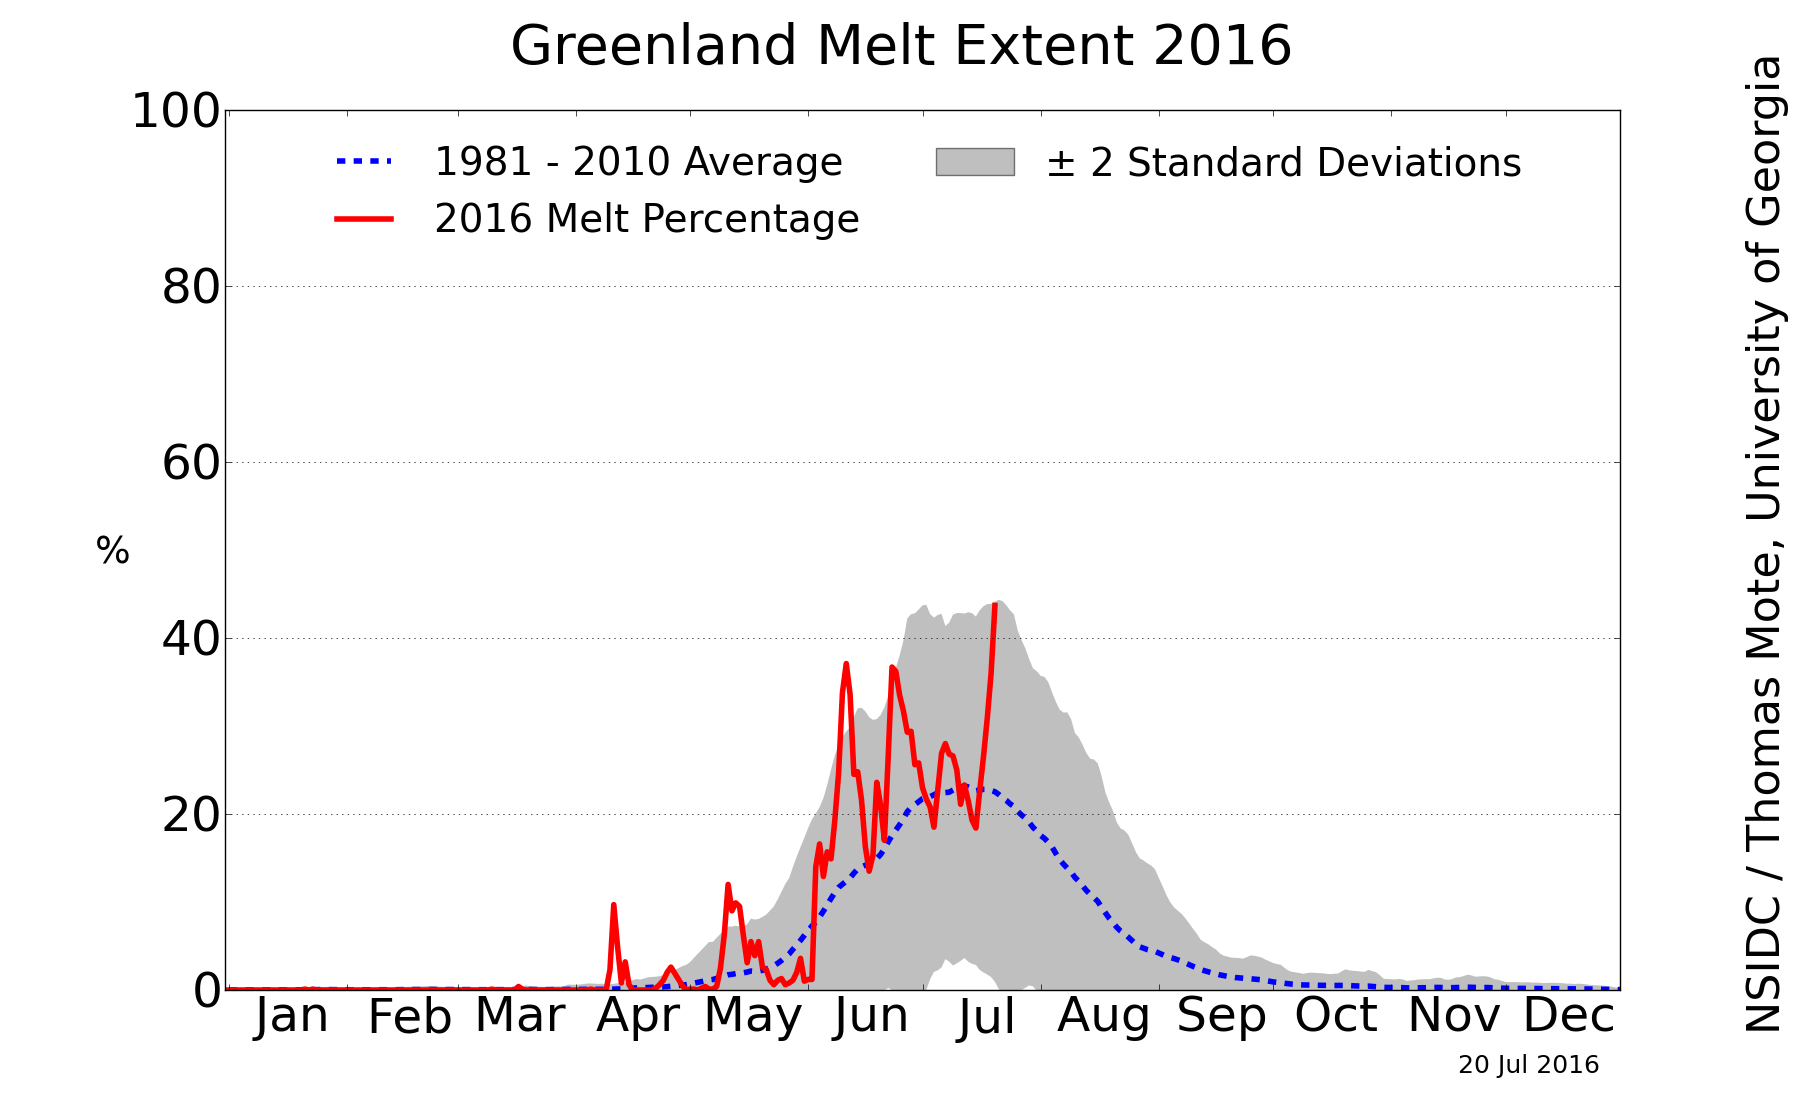
On June 9 2016, Nuuk, the capital of Greenland, reached the warmest temperature ever recorded for the month of June anywhere on the island, 24 degrees Celsius (75 degrees Fahrenheit). An article from NSDIC, published June 22 elaborated on the broader situation:
Surface melting on Greenland’s Ice Sheet proceeded at a brisk pace, with three spikes in the melt extent in late spring. At this point, the pace rivals but is slightly behind the record surface melt and runoff year of 2012 (record since 1979), although ahead of the three preceding seasons. Melting in 2016 is especially severe in southwestern Greenland, and moving beyond the 1981 to 2010 rate everywhere except the northwestern coast (northern Melville Coast). This has led to the early formation of melt ponds along the southwestern flank of the ice sheet and early run-off from the ice sheet.
People who follow the news from Greenland’s ice melting, remember that surface melt was remarkable during the 2012 melt season.
NSDIC Review (February 5, 2013): Greenland’s surface melting in 2012 was intense, far in excess of any earlier year in the satellite record since 1979. In July 2012, a very unusual weather event occurred. For a few days, 97% of the entire ice sheet indicated surface melting.
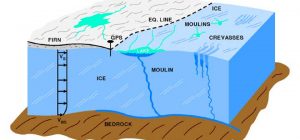
At the same time a science expedition took place around Leverett, and Russell Glacier, results were published in 2014, Molecular and biogeochemical evidence for methane cycling beneath the western margin of the Greenland Ice Sheet. You can consider the Russell Glacier region as one of the hardest hit during the annual melt season (pronounced surface melt and runoff through subglacial drainage – moulins and lakes beneath the ice sheet), the better known Jakobshavn Glacier is farther to the north, responsible for about 10% of Greenland’s icebergs and among the fastest to disappear.
The probing of runoff waters yielded a particular interesting result, the region was at least during the sample time (summer of 2012 and 2013), a source of atmospheric methane. The findings indicate that methanotrophs could serve as a biological methane sink in the subglacial ecosystem. Scaled dissolved methane flux during the 4 months of the summer melt season was estimated at 990 Mg CH4. Because the Russell-Leverett Glacier is representative of similar Greenland outlet glaciers, the researchers concluded that the Greenland Ice Sheet may represent a significant global methane source.
Another interesting study from 2014 on atmospheric methane and Greenland, which found that vegetation can act as a methane sink.
Net regional methane sink in High Arctic soils of northeast Greenland
Nature Geoscience8,20–23(2015)doi:10.1038/ngeo2305
Arctic tundra soils serve as potentially important but poorly understood sinks of atmospheric methane (CH4), a powerful greenhouse gas1, 2, 3, 4, 5. Numerical simulations project a net increase in methane consumption in soils in high northern latitudes as a consequence of warming in the past few decades3, 6. Advances have been made in quantifying hotspots of methane emissions in Arctic wetlands7, 8, 9, 10, 11, 12, 13, but the drivers, magnitude, timing and location of methane consumption rates in High Arctic ecosystems are unclear.
Here, we present measurements of rates of methane consumption in different vegetation types within the Zackenberg Valley in northeast Greenland over a full growing season. Field measurements show methane uptake in all non-water-saturated landforms studied, with seasonal averages of − 8.3 ± 3.7 μmol CH4 m−2 h−1 in dry tundra and − 3.1 ± 1.6 μmol CH4 m−2 h−1 in moist tundra. The fluxes were sensitive to temperature, with methane uptake increasing with increasing temperatures. We extrapolate our measurements and published measurements from wetlands with the help of remote-sensing land-cover classification using nine Landsat scenes. We conclude that the ice-free area of northeast Greenland acts as a net sink of atmospheric methane, and suggest that this sink will probably be enhanced under future warmer climatic conditions.
A study published in 2015 evaluated atmospheric methane in southwest Greenland
Arctic Antarctic and Alpine Research 47(4):599-609 · November 2015
Portable open-path laser (OPL) instruments provide a way to measure real-time, in situ atmospheric methane (CH4) concentrations at a variety of spatial and temporal scales. Our results suggest that OPL instruments may be simple and effective tools for monitoring atmospheric CH4 dynamics near ground-level in Arctic landscapes. We used a CH4 detecting OPL instrument at seven different field sites in southwest Greenland during the summer of 2012 to monitor atmospheric CH4 concentrations in the presence of local CH4 sources and sinks. Measurements with the OPL were conducted for deployments between 0.4 and 40 h over path lengths between 10 and 300 m. These measurements were checked against periodic grab samples analyzed in the field lab using cavity-enhanced absorption spectroscopy. Mean concentrations of atmospheric CH4 measured with the OPL across all field sites ranged from 1.72 (±0.12) to 1.88 (±0.15) ppm by volume (ppmv). The median atmospheric CH4 concentration measured using cavity-enhanced absorption spectroscopy was 1.82 ± 0.04 ppmv. Slightly elevated CH4 concentrations were measured downwind of one lake and in a subglacial cave. OPL measurements of atmospheric CH4 concentrations agreed with results from cavity-enhanced absorption spectroscopy (<3% difference). OPL technology may be a useful tool for extended CH4 monitoring studies in the Arctic and may help in our understanding of atmospheric CH4 concentrations at spatial and temporal scales not accessible to other forms of measurement.
Two years forward more studies have been published, scientists looked at ice sheets and methane, and found evidence for the occurrence of hydrates/clathrates beneath ice sheets. In the following abstracts from selected publications.
Arctic greenhouse-gas storage and release modulated by late-glacial ice sheet fluctuations
EGU General Assembly 2016, held 17-22 April, 2016 in Vienna Austria, p.7593
The subglacial footprint of the Barents Sea Ice sheet which advanced across northern Eurasia from 26 to 22 ka BP had a major impact on the underlying gas hydrate stability zone (GHSZ) leading to storage of methane and other hydrocarbons. With the onset of deglaciation, these hydrocarbon rich hydrates dissociated, releasing potent greenhouse gas into the ocean and possibly atmosphere over a period of thousands of years.
We present a wide-range of observational data acquired from offshore western Svalbard and the Barents Sea to robustly constrain a coupled model of the subglacial evolution of gas hydrate reservoirs during and after the Last Glacial Maximum (LGM). Our results indicate that even under minimum ice thickness reconstructions, an extensive, ~500-meter thick GHSZ existed beneath the ice sheet in our study area offshore of western Svalbard (Portnov et al., 2016). An offshore corridor of methane release did though also persist throughout maximum ice conditions on the upper continental margin.
Throughout the LGM a marine ice sheet directly comparable to those of Greenland and Antarctica today inundated the continental margin offshore of western Svalbard and the vast shelf areas of the Barents Sea. However, with climatic amelioration the Barents Sea ice sheet experienced a 4ka period of dynamic retreat with concurrent flooding of the shelf by rising sea levels, which provided a high magnitude perturbation to the substrate pressure and temperature domains.
By analogy, the future response of Polar ice sheets is an emerging concern as their ongoing thinning and retreat will likewise perturb the present day subglacial GHSZ (gas hydrate stability zone) leading to potential widespread gas hydrate destabilisation and release.
Ice-sheet-driven methane storage and release in the Arctic
Nature Communications,Article number:10314doi:10.1038/ncomms10314
It is established that late-twentieth and twenty-first century ocean warming has forced dissociation of gas hydrates with concomitant seabed methane release. However, recent dating of methane expulsion sites suggests that gas release has been ongoing over many millennia. Here we synthesize observations of ~1,900 fluid escape features—pockmarks and active gas flares—across a previously glaciated Arctic margin with ice-sheet thermomechanical and gas hydrate stability zone modelling. Our results indicate that even under conservative estimates of ice thickness with temperate subglacial conditions, a 500-m thick gas hydrate stability zone—which could serve as a methane sink—existed beneath the ice sheet. Moreover, we reveal that in water depths 150–520 m methane release also persisted through a 20-km-wide window between the subsea and subglacial gas hydrate stability zone. This window expanded in response to post-glacial climate warming and deglaciation thereby opening the Arctic shelf for methane release.
Regulation of ice stream flow through subglacial formation of gas hydrates
Nature Geoscience9,370–374(2016)doi:10.1038/ngeo2696
Variations in the flow of ice streams and outlet glaciers are a primary control on ice sheet stability, yet comprehensive understanding of the key processes operating at the ice–bed interface remains elusive. Basal resistance is critical, especially sticky spots—localized zones of high basal traction—for maintaining force balance in an otherwise well-lubricated/high-slip subglacial environment1. Here we consider the influence of subglacial gas-hydrate formation on ice stream dynamics, and its potential to initiate and maintain sticky spots. Geophysical data document the geologic footprint of a major palaeo-ice-stream that drained the Barents Sea–Fennoscandian ice sheet approximately 20,000 years ago. Our results reveal a ~250 km2 sticky spot that coincided with subsurface shallow gas accumulations, seafloor fluid expulsion and a fault complex associated with deep hydrocarbon reservoirs.
We propose that gas migrating from these reservoirs formed hydrates under high-pressure, low-temperature subglacial conditions. The gas hydrate desiccated, stiffened and thereby strengthened the subglacial sediments, promoting high traction—a sticky spot—that regulated ice stream flow. Deep hydrocarbon reservoirs are common beneath past and contemporary glaciated areas, implying that gas-hydrate regulation of subglacial dynamics could be a widespread phenomenon.
An example how surface conditions can rapidly affect a cave system, similarities with subglacial features affected by moulins may reflect what appears to be common pathways (limestone and ice sheet penetration related to surface conditions)
EGU General Assembly 2016, held 17-22 April, 2016 in Vienna Austria, p.8881 (PDF)
In shallow caves, episodes of speleothem deposition during the late Quaternary, constrained by U-series dates, provide unequivocal evidence for periods of climate amelioration (presence of liquid water, elevated soil pCO2). U-series data for speleothems from several cave systems in Ireland (Crag, Ballynamintra and Marble Arch) provide clear evidence for episodic speleothem deposition, ranging in age from Marine Isotope Stage (MIS) 7 to the Last Glacial Termination. Speleothem deposition and non-depositional phases within these caves are particularly sensitive to regional-scale climatic conditions, reflecting Ireland’s mid-latitudinal, Atlantic margin location. Currently, the earliest dated speleothems from the region are sparsely preserved and thin MIS 7 and MIS 5 flowstones from Ballynamintra and Crag caves respectively. Relatively short-lived depositional phases also occurred at Crag cave during MIS4 and MIS3 and are coeval with the Greenland Interstadials (GI), supporting the recently modified GICC05 Greenland ice core chronology (Buizert et al., 2015), and new providing evidence for synchronous or nearly-synchronous climate amelioration in the N. hemisphere mid- and high-latitudes during the GI events. On the other hand, there is strong evidence that conditions at Crag cave site during stadials and the Heinrich stadials were not conducive to speleothem deposition.
Episodes of non-deposition occur synchronously in several speleothems from Crag cave, providing independent constraints on the timing of Heinrich stadials HS-6 to HS-2. T
he new data also provide independent new insights into the behaviour of the British Irish Ice Sheet (BIIS) during MIS2. In this regard, the presence of a short depositional pulse at 23.35 ± 0.1 ka at Crag cave coincides precisely with the weak and short-lived GI2.2 event within MIS 2, suggesting a dynamic BIIS margin. Simple conductive thermal models for the propagation of surface air temperatures through the limestone karst indicates very rapid (typically sub-decadal) transfer of transient climate anomalies into the cave systems, underpinning the observed sensitivity of these systems to surface climatic conditions. Buizert et al. (2015) The WAIS Divide deep ice core WD2014 chronology – Part 1: Methane synchronization (68-31 ka BP) and the gas age-ice age difference. Clim. Past, 11, 153-173.
For some general background see:
Philosophical Trans, 28 January 2016 Volume 374, issue 2059
The distribution of life in the continental subsurface is likely controlled by a range of physical and chemical factors. The fundamental requirements are for space to live, carbon for biomass and energy for metabolic activity. These are inter-related, such that adequate permeability is required to maintain a supply of nutrients, and facies interfaces invite colonization by juxtaposing porous habitats with nutrient-rich mudrocks. Viable communities extend to several kilometres depth, diminishing downwards with decreasing porosity.
Carbon is contributed by recycling of organic matter originally fixed by photosynthesis, and chemoautotrophy using crustal carbon dioxide and methane. In the shallow crust, the recycled component predominates, as processed kerogen or hydrocarbons, but abiotic carbon sources may be significant in deeper, metamorphosed crust. Hydrogen to fuel chemosynthesis is available from radiolysis, mechanical deformation and mineral alteration.
Activity in the subcontinental deep biosphere can be traced through the geological record back to the Precambrian. Before the colonization of the Earth’s surface by land plants, a geologically recent event, subsurface life probably dominated the planet’s biomass.
In regions of thick ice sheets the base of the ice sheet, where liquid water is stable and a sediment layer is created by glacial erosion, can be regarded as a deep biosphere habitat. This environment may be rich in dissolved organic carbon and nutrients accumulated from dissolving ice, and from weathering of the bedrock and the sediment layer.
A new study (May 2016) looked at past ice sheet disintegration and possible future implications, based on grounded ice sheet retreat, following isostatic rebound and topographic features. The study suggests that catastrophic methane spikes are required for significant atmospheric impact.
Nature Communications,Article number:11509doi:10.1038/ncomms11509
Gas hydrates stored on continental shelves are susceptible to dissociation triggered by environmental changes. Knowledge of the timescales of gas hydrate dissociation and subsequent methane release are critical in understanding the impact of marine gas hydrates on the ocean–atmosphere system. Here we report a methane efflux chronology from five sites, at depths of 220–400 m, in the southwest Barents and Norwegian seas where grounded ice sheets led to thickening of the gas hydrate stability zone during the last glaciation. The onset of methane release was coincident with deglaciation-induced pressure release and thinning of the hydrate stability zone. Methane efflux continued for 7–10 kyr, tracking hydrate stability changes controlled by relative sea-level rise, bottom water warming and fluid pathway evolution in response to changing stress fields. The protracted nature of seafloor methane emissions probably attenuated the impact of hydrate dissociation on the climate system.
Large quantities of methane exist as free gas, dissolved in pore fluids and solid gas hydrates within marine sediments1. Gas hydrates are found in a variety of geological settings2 but are most common on continental margins where the combination of appropriate pressure–temperature conditions and the presence of organic-rich sediments are conducive to abundant methane generation. The stability of the marine gas hydrate reservoir is primarily affected by changes in temperature and hydrostatic pressure.
Consequently, changes in the thickness of the gas hydrate stability zone (GHSZ) are likely to occur along glaciated continental margins where pressure regimes are governed by alternating glacial loading and unloading cycles, and gas hydrate dissociation may be amplified by the influx of warmer waters following ice retreat2, 3, 4, 5.
If bottom water warming and/or hydrostatic pressure decrease is large enough, gas hydrate dissociation and release of a significant amount of methane are possible4, 6, 7, 8, 9, 10.
The transfer of this methane to the water column has the potential to amplify ocean acidification and de-oxygenation and, possibly, atmospheric greenhouse gas concentrations11, 12. The rates and timescales over which gas hydrates dissociate control the impact of hydrate-derived methane on the global climate system.
Methane released by the dissociation of marine gas hydrates has been inferred to be the cause of a number of negative δ13C excursions in the geological record6, 7. Large magnitude gas hydrate dissociation events are also proposed to have occurred in the more recent past, as evidenced by major fluid flow structures in sedimentary basins, such as pockmarks4, 13. However, the role of marine gas hydrate releases in influencing atmospheric methane concentrations during the Quaternary remains uncertain. For example, the radiocarbon and hydrogen isotopic composition of methane from Greenland ice cores suggests that atmospheric methane rise at 11.6 and 38 ka can be predominantly accounted for through wetland emissions14, 15. Although it appears that Quaternary marine gas hydrate dissociation events did not have a significant impact on the climate system, recent estimates of the gas hydrate reservoirs stored beneath the grounded Antarctic ice sheet suggest that methane release resulting from accelerated ice wastage has the potential to act as a positive feedback on future climate warming16.
Methane is consumed at a variety of stages during transport through the sediment and overlying water column. On a global scale, >80% of methane migrating within the sedimentary package can be microbially consumed at the sedimentary sulphate–methane transition zone by the anaerobic oxidation of methane (AOM)11, 17. However, where gas supply is high and flow through the sediment is advective, the capacity of this benthic microbial filter can be outstripped, resulting in release of methane into the overlying water column18. A proportion (up to 100%) of methane within the water column is consumed via dissolution of free gas bubbles and methanotrophic microbial activity19, 20 before it reaches the ocean surface and escapes into the atmosphere. Consequently, the short residence time of methane in the oceans and atmosphere (~10 years), combined with the processes that control consumption in the sediment and water column, requires a rapid (decadal) release and transfer of large volumes of methane to achieve a significant impact on ocean/atmosphere chemistry.
The processes that influence gas hydrate stability in continental margins act on timescales ranging from near instantaneous (for example, slope failure) to 102–103 years (ice sheet collapse), whereas significant sea-level and bottom water temperature variations operate over 103 years21,22. The transfer of methane from the seabed into the water column is typically detected by water column acoustic gas flares, with observations restricted to timescales of less than a few decades20,23. However, assessments of the timescales over which gas hydrate systems respond to the processes that drive changes in pressure and temperature in the subsurface are limited. Studies from GHSZ pinch outs indicate rapid response to temperature change in the immediate subsurface over a few decades8, 22.
Modelling results show that heat transfer and temperature re-equilibration of ~100 m of marine sediments would take 102–103 years8, 24, and that gas propagated from such depth may take an additional thousand years to vent at the seafloor24. However, empirical constraints on methane efflux triggered by hydrate dissociation resulting from glacial unloading of a continental margin, both past and present are, as yet, lacking.
(…)
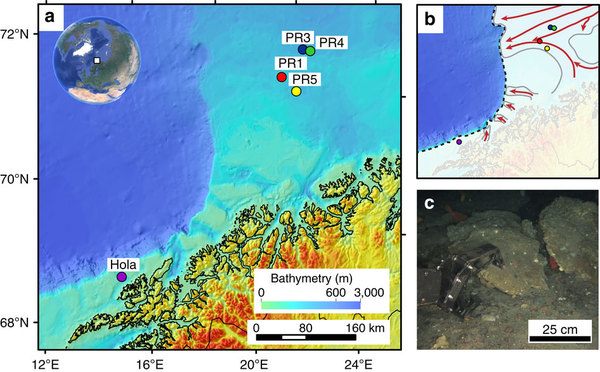
The shelf areas of the Norwegian and Barents Seas offer ideal settings in which to assess the processes governing gas hydrate stability on glaciated continental margins with grounded ice and hence can serve as a palaeo-analogue of the Antarctic gas hydrate reservoir16. Here we report on the timing of methane release in the Barents and Norwegian Seas, where a drop in seabed pressure associated with the retreat of the grounded Scandinavian Ice Sheet (SIS) has been inferred as the driving force behind the dissociation of a significant amount of gas hydrates3, 13, 31(Fig. 1).
(…)
We use U-Th geochronology, stable carbon and oxygen isotope analyses and petrographic observations on authigenic carbonate crusts associated with methane seeps to provide constraints on the timescales of past methane fluxes from five locations for that region. Our new U-Th data set, combined with model estimates of the amount of methane potentially stored as gas hydrates before and after the collapse of the SIS offers an opportunity to study the timescales of methane efflux across the seafloor in response to the environmental changes associated with the last deglaciation.
The southwest Barents and Norwegian Sea are active provinces for oil and gas exploration, with extensively documented, focused, hydrocarbon-rich fluid migration through regional fault networks3, 32, 33. Mega-scale glacial lineations (for example, in the Ingøydjupet depression) indicate that the shelf areas of those seas were covered by the grounded SIS during the last glaciation34, 35, 36. The pressure exerted by grounded ice on the underlying sediments was associated with a ~500 m thickening of the GHSZ3, 37 and reactivation of faults and fractures as fluid pathways. Age constraints on grounded ice wedges indicate that ice persisted on the southwest Barents Sea shelf at least until 17 ka38, 39, and that ice streams extended to the edge of the shelf at least twice34, 36. In this area the seafloor is marked by ubiquitous pockmarks, circular depressions resulting from the expulsion of fine-grained sediments in response to fluid seepage3,13, 31, 40, 41. Although some pockmarks coincide with observed water-column gas flares, indicating active seepage, most are inactive and constitute records of widespread fluid escape at the seafloor related to abrupt gas hydrate dissociation after the last deglaciation3, 13, 31. The cross-cutting relationships between pockmarks and surrounding sediments, coupled with radiocarbon dating, indicate that pockmark formation post-dated the deposition of glaciomarine sediments at ~15 ka31.
(…)
Gas hydrate stability modelling
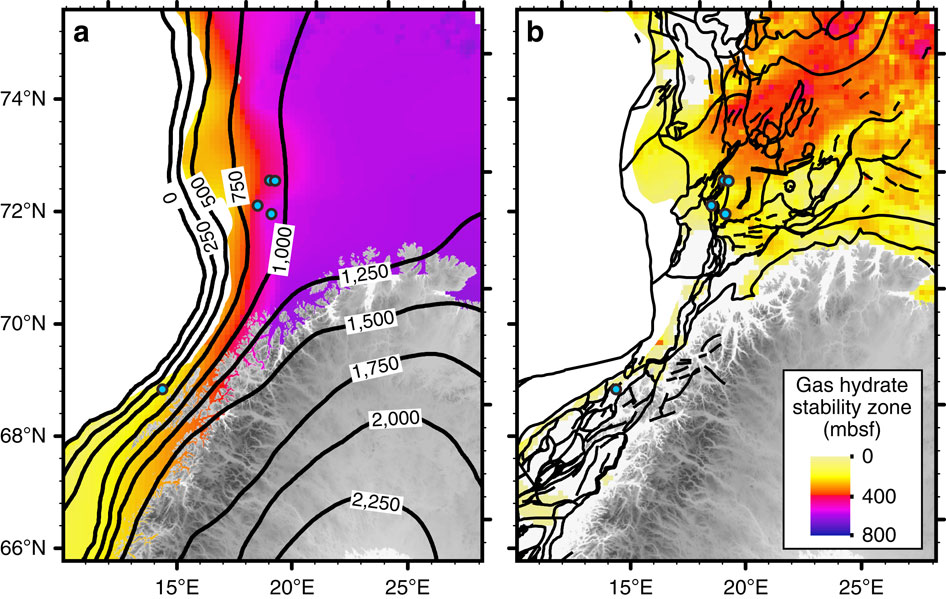
Gas hydrate stability was modelled at steady state based on the presence of an ~1,100-m-thick grounded ice sheet51, the regional average geothermal gradient of 31 °C km−1 (ref. 52) and a gas composed of 96% methane, 3% ethane and 1% propane. Such a gas composition is consistent with the base of the GHSZ corresponding to the observed bottom-simulating seismic reflectors in the Barents Sea37, 53. The model estimates the thickness of the GHSZ at up to 600 m below the seafloor during the Last Glacial Maximum (LGM), thinning gradually towards the shelf edge due to decreasing ice load (Fig. 5a). Following the retreat of grounded ice, which triggered isostatic rebound, sea-level rise and bottom water warming, the GHSZ thinned to ca. 100 m in most of the southwest Barents Sea, including the study area. A thicker GHSZ of up to 400 m persists in the deeper, central part of the southwest Barents Sea (Fig. 5b). Based on the volume change of gas hydrates between the LGM (Fig. 5a) and the present day (Fig. 5b), we estimate that 5–43 Gt of methane was released in the studied area (4 × 10⁵ km2).
Discussion
(..)
The U-Th ages and the presence of isotopically heavy oxygen (>5‰ VPDB) support a model in which methane is discharged from gas hydrate dissociation, triggered by pressure changes on the continental shelf due to collapse and retreat of the SIS3, 31. The U-Th data further indicate that substantial methane efflux continued along the ice-free northern Norwegian margin for another ca. 10 kyr. Although the carbonate crust U-Th data are limited in coverage, the clustering of U-Th dates (Fig. 4) does suggest that methane efflux may have been pulsed. U-Th ages of distinct layers within cavity infills provide evidence for sustained methane fluid flow through individual conduits over 900 years (Fig. 2b).
(…)
During the LGM (Last Glacial Maximum), the SIS covered most of Northern Europe, including the Norwegian continental shelf and the entire Barents Sea55, 56. Glacial loading by about 1,100 m of grounded ice51 created a 150- to 200-m isostatic depression of the lithosphere57 and the resulting increase of hydrostatic pressure in the underlying sediments extended the GHSZ to up to 600 m below the seafloor throughout the Barents Sea and the Norwegian shelf (Figs 5a and 6). Ice loading probably reactivated widespread basement-penetrating fault systems enhancing the migration of gas originating in Triassic and Jurassic source rocks and hydrocarbon reservoirs58. The accumulation of thermogenic gas in the upper part of the sediment column, corresponding to the GHSZ, would have enabled widespread gas hydrate formation beneath the ice cap during the LGM (Fig. 6a).
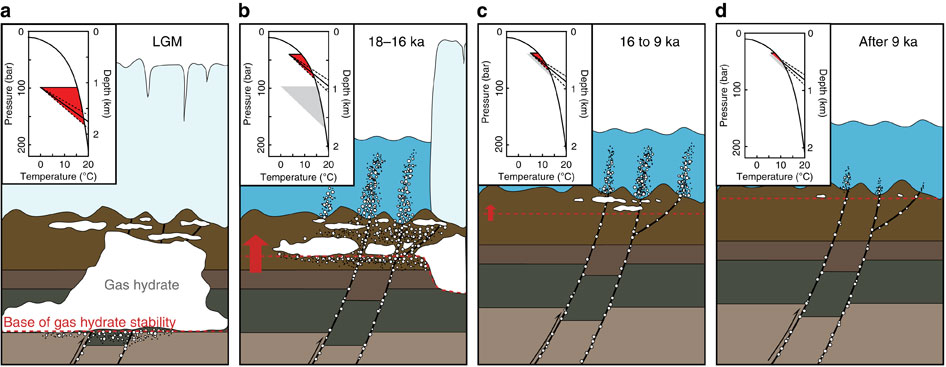
The retreat of the SIS from the shelf margin began at 19 ka and comprised several episodes of ice retreat and advance with grounding zone wedge formation35, 39. The western Barents Sea, including our study area, was deglaciated over a 2-kyr period, with ice-free conditions reached at ~16 ka39. The pressure drop associated with ice sheet unloading led to thinning of the GHSZ by as much as 400 m, resulting in gas hydrate dissociation and thereby increased pore pressure, triggering methane advection (Fig. 6b). Assuming a Darcy linear flow model, the dissipation of pore pressure from the seafloor to the base of the LGM GHSZ (600 m below seafloor) during glacial retreat is expected to have taken between 0.005 and 4.6 kyr, to reach the steady state (permeability of 0.04 mD to 1.51 D59 and water viscosity of 2.04 × 10⁻³ Pa˙s). In addition, the rate of gas hydrate dissociation, position within the sedimentary column and the fluid flow velocity would potentially affect the time over which the fluids reach the seafloor. As carbonate crusts are forming at fluid flow velocities between 20 and 60 cm per year60, the methane migration at such velocities from the base of the LGM GHSZ (600 m) to the seafloor would take between 1 and 3 kyr.
Following the SIS collapse, isostatic rebound caused a ca. 90 m uplift of the seafloor between 16 and 6 ka (Fig. 4), and at the same time sea-level rose ca. 120 m (ref. 61), resulting in a minor net increase in hydrostatic pressure. Changes in stress over this time interval associated with glacial unloading and isostatic rebound resulted in reactivation of pre-existing faults in certain orientations relative to the evolving stress field62 and would have facilitated fluid migration from shallow gas reservoirs generated by gas hydrate dissociation and/or from deeper petroleum systems. Gas hydrate dissociation was further promoted by the inflow of warm Atlantic water into the Barents Sea shelf after deglaciation, as bottom water temperatures rose from 4 °C at ~15 ka to 6 °C at ~10 ka with 1–2 °C fluctuations on 100-year timescales (Fig. 4), remaining relatively stable during the Holocene. The heat transfer would take several hundred years to propagate through the sediments and reach the base of the GHSZ24. Consequently, post-glacial gas hydrate destabilization possibly continued until ~9–7 ka under the combined influence of seabed uplift and temperature increase (Fig. 6c). At present, gas seepage as evidenced by flares in the water column in the Barents Sea is mainly observed above deep-seated faults (Fig. 6d) with methane sourced from petroleum reservoirs.
We estimate that 10 × 103 – 88 × 103 Tg of methane was stored as gas hydrate in the southwest Barents Sea shelf during the LGM, which is equivalent to 0.6–4.9% of the current total oceanic gas hydrate reservoir63. As our study area only represents ca. 30% of the glaciated Barents Sea shelf and ca. 5% of all glaciated shelves with grounded ice sheets (that is, Norwegian margin, Antarctica and Greenland), it is likely that significant amounts of methane were stored in such shelf settings during the LGM. However, the impact of oceanic gas hydrate dissociation on the climate system is limited by the atmospheric transfer rate of methane, which is a function of timescales of dissociation and release rates at the seafloor, the efficiency of methane oxidizers and bubble dissolution in the water column, and the thickness of the water column. Modelling estimates show that under normal oceanographic conditions, methane released at water depths >200 m would be almost entirely (>80%) consumed during transit towards the sea surface20, and that a catastrophic bubble release is required, to drive transport of methane from deeper waters (>100 m) to the atmosphere20. As water depth in the investigated areas of the Norwegian and Barents Sea was on the order of 200–400 m after ice sheet collapse, the resulting impact on atmospheric methane concentrations was probably muted. Furthermore, methane release at the sediment–water interface was also probably modulated by the availability of excess methane and fluid pathways to the seafloor, with slower transit through the sediment column increasing the magnitude of microbial methane consumption within the sedimentary sulphate methane transition zone. Assuming that 90% of the methane released by gas hydrate dissociation is consumed by AOM11, and that 1–5% of it would pass through the water column and reach the atmosphere, the mean integrated flux to the atmosphere in the southwest Barents Sea over 10 kyr would be about 0.0005–0.0172 Tg·per year (minimum and maximum estimates) of methane, which is relatively small when compared with the ~200 Tg·per year methane flux from all natural sources64. Such a scenario of protracted, relatively low-intensity methane efflux in response to abrupt environmental changes has rarely been evaluated by studies that postulate linkages between gas hydrate dissociation and transfer of methane to the marine realm/atmosphere. However, on shallow continental shelf regions (that is, <150–200 m water depth) that have also experienced glacial–interglacial cycles, it is plausible that a higher proportion of the methane released by gas hydrate dissociation may have passed through the water column and reached the atmosphere.
The main episode of carbonate crust formation in the Barents Sea after the collapse of the SIS broadly overlaps with elevated atmospheric methane concentrations as recorded by ice cores from Greenland and Antarctica65. The potential importance of gas hydrate destabilization due to warming of upper oceanic water masses as a cause for elevated atmospheric methane has been debated in several publications4, 10. The hydrogen isotope and 14C characteristics of methane trapped in ice cores suggest insignificant emissions from marine gas hydrates during times of high atmospheric methane after deglaciation and stability of gas hydrates14, 66. However, the general inference of gas hydrate stability within continental margin sediments through glacial–interglacial cycles is not globally applicable, as it is dependent on local changes in temperature and hydrostatic pressure. This is particularly important in case of glaciated continental margins where gas hydrate destabilization was triggered by local reduction in pressure effects of collapsing grounded ice sheets. Reliable assessment of the influence of hydrate-released methane from glaciated margins on the climate system after the LGM requires global quantification of methane storage, release and consumption budgets, constraints of timescales of hydrate dissociation, and temporal and volume estimates of the dynamics of ice sheets. Such global data are not currently available. Abrupt, globally synchronous methane release over a timescale of 102 years from deglaciated shelf areas with grounded ice appears unlikely given the protracted nature of hydrate-derived methane efflux after the LGM, as our findings from the southwest Barents Sea indicate, as well as the asynchronous deglaciation of different shelf areas.
The analysis of methane-derived authigenic carbonate through the integration of U-Th geochronology and geochemical proxies, combined with gas hydrate modelling provides a means for evaluating past methane release from glaciated continental margins where gas hydrate dynamics are governed by glacial–interglacial cycles. Modelling results demonstrate that gas hydrate accumulation beneath grounded ice-sheets on the Norwegian margin, in a setting analogous to the present day Antarctic shelf16, generates potentially significant methane reservoirs the stability of which is sensitive to environmental changes affecting local pressure and temperature regimes. Although significant amounts of methane could have been released at the seafloor and transferred to the water column, U-Th geochronology suggests methane release over a ca. 10 kyr interval implying that flux rates were modulated by the second-order processes controlling both the rate of dissociation (isostatic rebound and bottom water warming), fluid transport (changes in stress fields leading to fault reactivation under the control of isostatic rebound) and consumption (via efficiency of microbial oxidation). Overall, the protracted nature of methane release on the Norwegian margin and its minimal impact on atmospheric methane concentrations highlight the complexity of the gas hydrate system and the importance of mechanisms mediating gas hydrate dissociation and fluid advection in response to abrupt climatic change.
The research from the last couple of years suggests that at least methane hydrates are likely emerging as a chronic more gradual process over thousands of years through permafrost, ocean bottom warming, and ice sheet retreat.
However, based on the quoted study above the possibility of isolated regional catastrophic spikes can not be ruled out completely (i.e. slope failure, ice sheet disintegration), since it depends on local characteristics, such as fault lines and the compartment of methane reservoirs. Ultimately to judge future atmospheric methane content, the situation must be evaluated based on all methane sources (wetlands, permafrost, hydrates, subglacial, natural sinks, human origin etc). Thus, different smaller sources could add up over time and make global warming considerable worse.
Read also Arctic and American Methane in Context (2013), Methane release from melting permafrost could trigger dangerous global warming (2015)
And then it is unclear how important subglacial methane cycling due to Greenland’s melting is for the atmospheric methane budget, and if there is a trend?
Meanwhile, Greenland’s ice sheet melting is progressing, below a snapshot from July 20, 2016.
Teaser image: The west coast of Greenland, via MODIS Terra for 20th July 2016, the area just south of Jakobshavn. Large regions show melt ponds and dark surfaces.
Related
- Methane excess in Arctic surface water- triggered by sea ice formation and melting (2015)
- Impacts of Global Change: Continental Ice Loss in Polar Regions (2016 Univ. Maryland, 1 page Overview)
- Recent advances in understanding Antarctic subglacial lakes and hydrology (2015)
- Setting a chronology for the basal ice at Dye-3 and GRIP: Implications for the long-term stability of the Greenland Ice Sheet (2016)
- Trembling tundra – the latest weird phenomenon in Siberia’s land of craters