Climate proxy reveals CO2 content of Earth’s atmosphere, of the past 400 million years
The study New constraints on atmospheric CO2 concentration for the Phanerozoic (DOI: 10.1002/2014GL060457), by Peter J. Franks, Dana L. Royer, David J. Beerling , Peter K. Van de Water, David J. Cantrill, Margaret M. Barbour, and Joseph A. Berry, estimates CO2 in Earth history based on a new climate proxy.
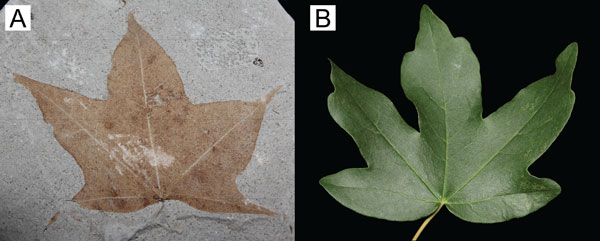
Estimates are in particular based on carbon isotope-13 ratios and stomatal anatomy in naturally preserved leaf material, leaf intercellular CO2 concentrations offer new insights into the carbon content of past atmospheres.

Study key points
- A novel CO2 proxy calculates past atmospheric CO2 with improved certainty
- CO2 is unlikely to have exceeded ~1000 ppm for extended periods post Devonian
- Earth’s long-term climate sensitivity to CO2 is greater than originally thought
The study abstract
Earth’s atmospheric CO2 concentration (ca) for the Phanerozoic Eon is estimated from proxies and geochemical carbon cycle models. Most estimates come with large, sometimes unbounded uncertainty.
Here, we calculate tightly constrained estimates of ca using a universal equation for leaf gas exchange, with key variables obtained directly from the carbon isotope composition and stomatal anatomy of fossil leaves. Our new estimates, validated against ice cores and direct measurements of ca, are less than 1000 ppm for most of the Phanerozoic, from the Devonian to the present, coincident with the appearance and global proliferation of forests.
Uncertainties, obtained from Monte Carlo simulations, are typically less than for ca estimates from other approaches. These results provide critical new empirical support for the emerging view that large (~2000–3000 ppm), long-term swings in ca do not characterize the post-Devonian and that Earth’s long-term climate sensitivity to ca is greater than originally thought.
The authors explain the measurements, as follows:
The fractionation of carbon isotopes during photosynthesis causes the carbon products used to synthesize leaf tissue to be relatively depleted in the heavier 13C isotope [Farquhar et al., 1989]. The assimilation-weighted average of this discrimination against 13C, quantified as Δ13C [Farquhar et al., 1989], is routinely measured in the carbon-based remains of plants preserved as fossils, such as the highly durable leaf cuticle [Beerling et al., 2002].
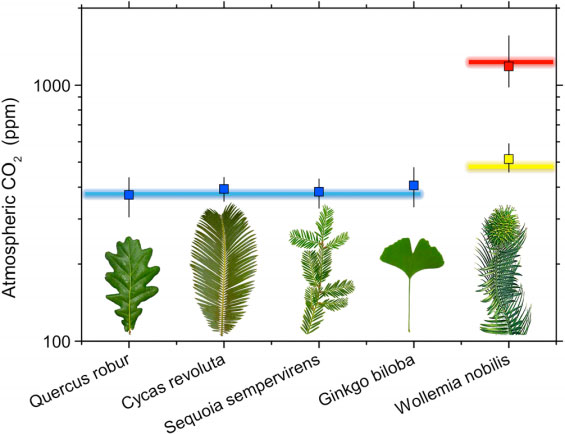
Model validation with extant species. Modeled ca (symbols; error bars span 16–84 percentiles) closely matches the value of ca in which the sample leaves grew (colored lines). Blue line represent current ambient atmospheric CO2 concentration in which Quercus robur, Cycas revoluta, Sequoia sempervirens, and Ginkgo biloba were growing under natural conditions outdoors; yellow and red lines represent, respectively, 480 and 1270 ppm atmospheric CO2 concentration inside controlled environment chambers where Wollemia nobilis was grown.
The results reduced uncertainty in proxy records and improved earlier estimates and contribute to our understanding of climate change today, especially the findings hint at a higher climate sensitivity to CO2 emissions.
Phanerozoic CO2
Calculated ca is below 1000 ppm for most of the Phanerozoic, from the Devonian onwards (Figure 4d, red symbols). Overall, the trend in Phanerozoic ca follows that of the GEOCARBSULFvolc long-term carbon cycle model (Figure 4d, black line), except for the late Mesozoic (~140 Myr ago) where the fossil model yields somewhat lower ca. The highest ca since the Devonian occurs during the Mesozoic greenhouse interval (~240–60 Myr ago) while ca is at its lowest, near current day values, during the glacial intervals of the late Paleozoic (~300 Myr ago) and late Cenozoic (last 34 Myr)
Our results highlight a fundamental transition in Earth’s atmosphere following the evolution of forests in the mid Devonian (~390 Myr ago) [Stein et al., 2012]. Up until this point, according to both the GEOCARBSULFvolc and fossil models, ca exceeded 1000 ppm.
However, for the remainder of the Phanerozoic ca was less than 1000 ppm, consistent with the emergence of global forests that captured and sequestered vast amounts of carbon from the atmosphere [Berner, 2003]. Forests also enhanced silicate mineral weathering, further removing CO2 from the atmosphere via the deposition of carbonates in deep ocean sediments [Berner, 2003].
We emphasize that our low-resolution record bears most directly on long-term fluctuations in atmospheric CO2; we cannot exclude the possibility for short-term CO2 excursions exceeding 1000 ppm, for example during the mass extinction at the Triassic-Jurassic (T-J) transition ~201 Myr ago [McElwain et al., 1999; Steinthorsdottir et al., 2011]. Our new Phanerozoic CO2 record provides critical empirical support for the view that ca has largely remained under 1000 ppm since the Devonian (the last ~350 Myr) [Breecker et al., 2010].
Until now, this view was based mainly on reanalysis of ca estimates from the isotopic composition of carbonates in paleosols, the only extensive proxy record to span most of the Phanerozoic.
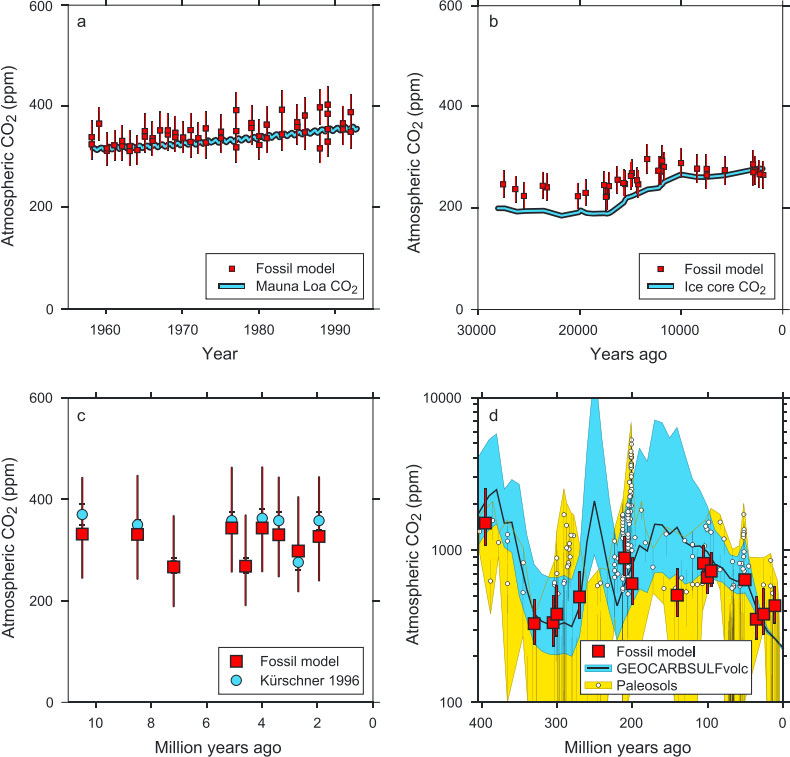
Figure 4 Atmospheric CO2 concentration, ca, calculated for different geological timescales. All red symbols are ca values calculated from fossil leaves (or, for panel a, leaves preserved in peat). Error bars on red symbols span 16–84 percentiles (similar to ±1 σ), unless noted otherwise.
(a) Validation against direct measurements of ca (blue line) at Mauna Loa observatory, Hawaii, from 1958 to 1994 [Tans and Keeling, 2012], using leaf information for Betula pendula from Wagner et al. [1996];
(b) validation against measurements of ca from ice cores [Smith et al., 1999; Monnin et al., 2004) (blue line) for 27–2 kyr before present, showing the Pleistocene-Holocene transition, using fossil information for Pinus flexilis from Van de Water et al. [1994];
(c) comparison with stomatal index-based estimates [Kürschner et al., 1996] (blue symbols; associated bars represent s.e.m.) for ~10– 2 Myr before present, using fossil information for Quercus petraea in Kürschner et al. [1996]; error bars represent 18 and 84 percentiles to allow better comparison with the stomatal index-based estimates;
(d) ca modeled using fossil information for multiple species from published studies (see Table S7), compared with estimates from GEOCARBSULFvolc (black line; 10–90 percentile error in blue; [Berner, 2008; Royer et al., 2007]) and paleosol carbonate (updated from Park and Royer [2011]; error envelope in yellow).
Paleosol estimates are revised with downward-corrected soil respiration term S(z) following Breecker et al. [2010]. For paleosol estimates under 500 ppm, only the error ranges are plotted, in keeping with the general loss of precision of this method at low CO2.
It emerges that long-term atmospheric CO2 concentration since the Devonian is constrained between the lower and upper limits of ~200 to 1000 ppm, possibly via strong negative feedbacks in the geochemical carbon cycle. Terrestrial plants may play a central role in this process. Stabilization of ca at the lower limit of 200–250 ppm during the past 24 Myr appears to result from a strong negative feedback in the form of attenuation of silicate rock weathering as terrestrial vegetation approaches CO2 starvation [Pagani et al., 2009].
Conversely, accelerated silicate weathering at elevated atmospheric CO2 may be a dominant negative feedback helping to keep ca below 1000 ppm. These new constraints on Phanerozoic ca will greatly assist in establishing benchmarks for Earth system sensitivity to CO2 (also known as “slow-feedback” or “long-term” climate sensitivity). If peak Phanerozoic ca is of the order of 1000 ppm then either slow-feedback climate sensitivity is greater than the canonical fast feedback value of 3°C for 2 × CO2 [Solomon et al., 2007], or global temperatures have been no warmer than ~6°C above preindustrial conditions.
The latter possibility is at odds with most paleotemperature records [Schouten et al., 2003; Tripati et al., 2003; Pearson et al., 2007; Littler et al., 2011; Royer et al., 2012]. As we face a potential doubling or tripling of ca from its preindustrial value by the end of this century [Solomon et al., 2007], a long-term climate sensitivity exceeding 3°C for CO2 doubling has important ramifications for a range of critical global economic, social, and political issues [Hansen et al., 2013].
The possibility of higher climate sensitivity to CO2 in the face of inevitable increases in atmospheric CO2 concentration should be considered within the framework of climate adaptation policy.
Read the full study, including the section on Validation Against Modern CO2 Measurements and Ice Cores, Models/Methods and Model Boundaries and Sensitivity.
Access the supporting study information via Wiley
Teaser image via Fossil Museum
Related
- Volcanoes, Tree Rings, and Climate Models: This is how science works
- Fossil Focus: Using Plant Fossils to Understand Past Climates and Environments
- Atmospheric oxygen over Phanerozoic time
- Coupled carbon isotopic and sedimentological records from the Permian system of eastern Australia reveal the response of atmospheric carbon dioxide to glacial growth and decay during the late Palaeozoic Ice Age
Support Earth Climate

About the Author: EARTH CLIMATE
Newsletter
Recent Comments
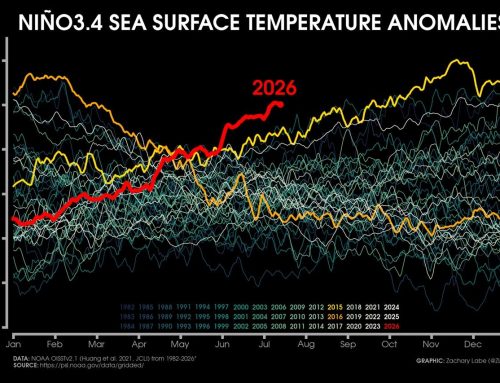
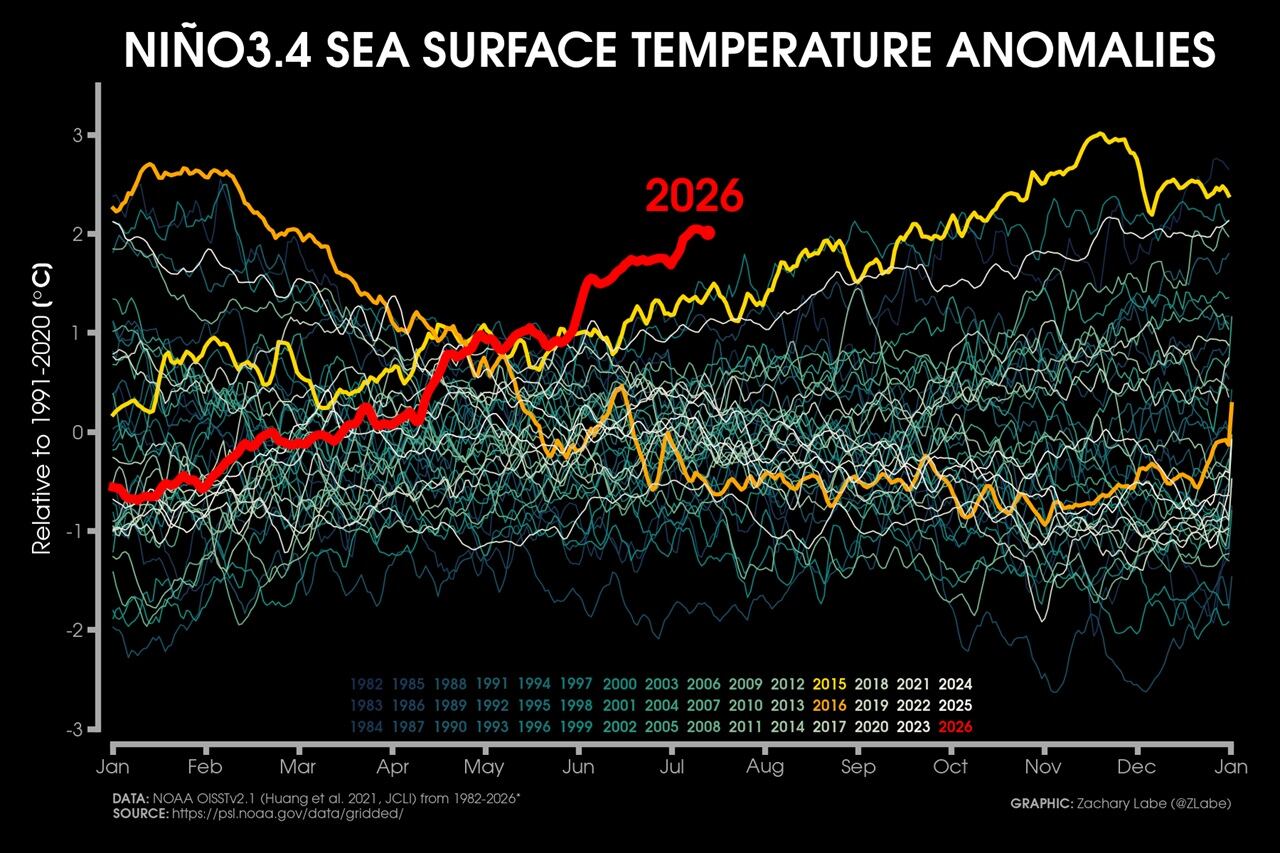
- Extreme Temperature Diary- Saturday July 18th, 2026/Main Topic: The “Super” El Niño of 2026: Why 2027 Will Be a Year That Is Off the Chain Hot – Guy On Climate on The “Super” El Niño of 2026: Why 2027 Will Be the Year the World Watches
- Gemma on The “Super” El Niño of 2026: Why 2027 Will Be the Year the World Watches
- Haiku on Breakthrough in Measuring Methane Emissions
Support
We create visually compelling, accessible science content that transforms complex research into engaging videos and articles, helping millions understand the discoveries shaping our world. [Paypal | Patreon]