World ocean heat content and thermosteric sea level change (0 – 2000 m), 1955 – 2010
S. Levitus, J. I. Antonov, T. P. Boyer,O. K. Baranova,H. […]
Date Posted:
September 2, 2013
S. Levitus, J. I. Antonov, T. P. Boyer,O. K. Baranova,H. E. Garcia,R. A. Locarnini,A. V. Mishonov,J. R. Reagan,D. Seidov,E. S. Yarosh, and M. M. Zweng | published 17 May 2012
Abstract
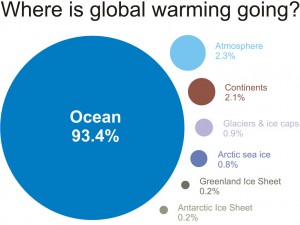
We provide updated estimates of the change of ocean heat content(OHC) and the thermosteric component of sea level change of the 0–700 and 0–2000 m layers of the World Ocean for 1955–2010. Our estimates are based on historical data not previously available, additional modern data, and bathythermograph data corrected for instrumental biases. We have also used Argo data corrected by the Argo DAC if available and used uncorrected Argo data if no corrections were available at the time we downloaded the Argo data. The heat content of the World Ocean for the 0–2000 m layer increased by 24.0 +- 1.9 x 10^22J(+-2S.E.) corresponding to a rate of 0.39 W m^2 (per unit area of the World Ocean) and a volume mean warming of 0.09C. This warming corresponds to a rate of 0.27 W m^-2 per unit area of earth’s surface. The heat content of the World Ocean for the 0–700 m layer increased by 16.7 +- 1.6 x 10^22J corresponding to a rate of 0.27 W m^-2 (per unit area of the World Ocean) and a volume mean warming of 0.18C. The World Ocean accounts for approximately 93% of the warming of the earth system that has occurred since 1955. The 700–2000 m ocean layer accounted for approximately one-third of the warming of the 0–2000 m layer of the World Ocean. The thermosteric component of sea level trend was 0.5 +- .05 mm yr^-1 for the 0–2000 m layer and 0.41 +- .04 mm yr^-1 for the 0–700 m layer of the World Ocean for
1955–2010. Citation:Levitus, S., et al. (2012), World Ocean heat content and thermosteric sea level change (0–2000 m),1955–2010,Geophys. Res. Lett.,39, L10603, doi:10.1029/2012GL051106
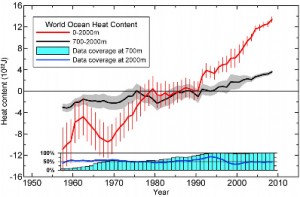
Figure 1.Time series for the World Ocean of ocean heat content (10^22J) for the 0–2000 m (red) and 700–2000 m (black)layers based on running pentadal (five-year) analyses. Reference period is 1955–2006. Each pentadal estimate is plotted at the midpoint of the 5-year period. The vertical bars represent +/2.*S.E. about the pentadal estimate for the 0–2000 m estimates and the grey-shaded area represent +/2.*S.E. about the pentadal estimate for the 0–700 m estimates. The blue bar chart at the bottom represents the percentage of one-degree squares (globally) that have at least four pentadal one-degree square anomaly values used in their computation at 700 m depth. Blue line is the same as for the bar chart but for2000 m depth.
Discussion
One important result presented here is that each major ocean basin has warmed at nearly all latitudes. A net warming has occurred despite inter annual to decadal variability of the ocean associated with phenomenon such as the El Niño-Southern Oscillation(ENSO), the Pacific Decadal Oscillation(PDO), and the North Atlantic Oscillation(NAO) as well as other such phenomenon.
The fact that relative extremes of OHC are a function of latitude and in some cases are at different latitudes in each major ocean basin indicates different ocean, or ocean-atmosphere, responses to the common forcing of the observed increase in greenhouse gases in earth’s atmosphere occurred. Although carbon dioxide is well mixed in the atmosphere, the response of earth’s climate system to increasing atmospheric greenhouse gases is not simple [Caiet al., 2010].
Work by Lee et al.[2011] documents interbasin exchange of heat that is of possible relevance to both internal and anthropogenic variability of the world ocean.[18] Using model simulations based on AOGCM simulations, Dommenget[2009] concluded that “continental warming due to anthropogenic forcing (e.g., the warming at the end of the last century or future climate change scenarios) is mostly (80%–90%) indirectly forced by the contemporaneous ocean warming, not directly by local radiative forcing.” Thus even if greenhouse gas emissions were halted today than regardless of the residence time of the carbon dioxide in today’s atmosphere, the ocean would continue to heat the atmosphere [Wetherald et al., 2001] .[19]
One feature of our results is that the previous multi-decadal increase in OHC700 that we have reported [Levituset al., 2009] (updated estimates available online at http://www.nodc.noaa.gov) leveled off during the past several years. This leveling is not as pronounced in our OHC2000 estimates indicating that heat is being stored in the 700–2000 m layer as we have shown here. We also note that our new yearly OHC2000 time series (not shown here) indicate that the positive trend in this quantity continues through 2011 although with inter annual and inter seasonal variability apparent.[20]
We emphasize that despite the surface intensification of the observed ocean warming, subsurface layers make a substantial contribution to the increase in OHC. Heat may have been stored at ocean depths exceeding 2000 m during the observational period we are studying and may be of significance for earth’s heat balance. We simply do not have enough in situ CTD or reversing thermometer data from depths exceeding 2000 m available to ascertain if there is a contribution from this layer. If the results of Kouketsu et al.[2011] are correct, this would mean a contribution of 1.6 +- 10^22J from the ocean region in the 3000 m-bottom layer. However a reduction of global ocean heat storage may result from the increase of sulfur in earth’s atmosphere due to increased burning of coal as well as decreased solar radiation and changes in the state of ENSO as recently suggested by Kaufmann et al.[2011].
Observed changes in stratospheric water vapor [Solomon et al., 2010] and stratospheric aerosols [Solomon et al., 2011] may also have contributed. Church et al.[2011] discussed these factors in a study of the variability of ocean heat content and sea level.[21]
We have estimated an increase of 24 x 10^22J representing a volume mean warming of 0.09C of the 0–2000 m layer of the World Ocean. If this heat were instantly transferred to the lower 10 km of the global atmosphere it would result in a volume mean warming of this atmospheric layer by approximately 36C (65F). This transfer of course will not happen; earth’s climate system simply does not work like this. But this computation does provide a perspective on the amount of heating that the earth system has undergone since 1955.[22]
All data and pentadal analyses used in this study as well as the yearly and seasonal gridded heat content fields are freely available at (http://www.nodc.noaa.gov/OC5/indprod.html). This is in accordance with IPCC, ICSU, IOC, and national data policies of many countries. Source (PDF)
Further reading
A new study published on May 10, 2013 in the journal Geophysical Research Letters has discovered that deep ocean waters below 700 meters (2,300 feet) have heated up unexpectedly since the year 2000. Source
Related
A Looming Climate Shift: Will Ocean Heat Come Back to Haunt us?
Could humans cause another Paleocene-Eocene Thermal Maximum?
Does Sea Ice loss create the condition for an emerging permanent El Nino state?