Michael Mann: The Hockey Stick and Climate Wars
For the Yale Forum on Climate Change & The Media focuses on climate scientist Michael Mann and his first-hand view of his hockey stick and ‘climate wars’ experiences.
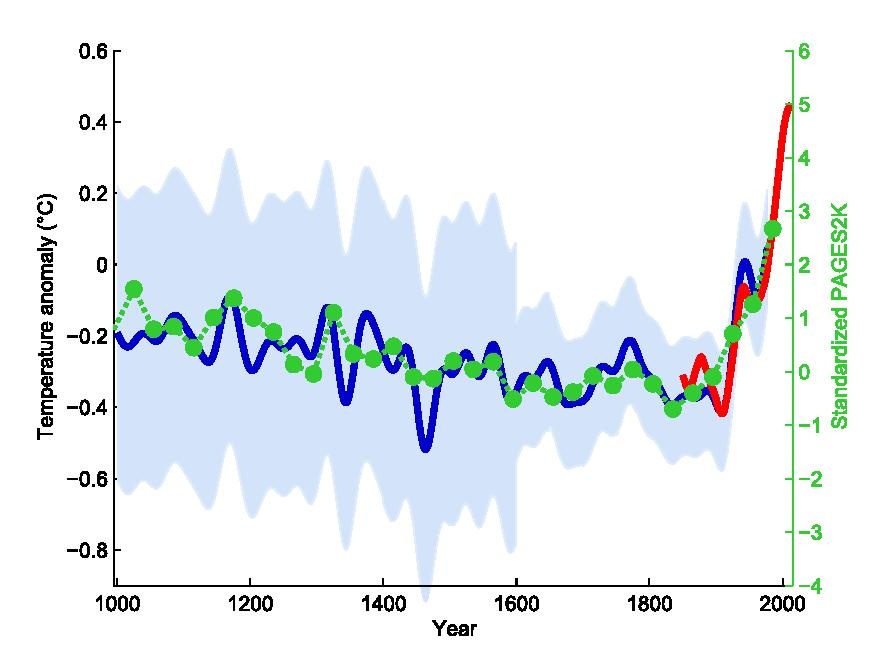

The original northern hemisphere hockey stick graph of Mann, Bradley & Hughes 1999, smoothed curve shown in blue with its uncertainty range in light blue, overlaid with green dots showing the 30-year global average of the PAGES 2k Consortium 2013 reconstruction. The red curve shows measured global mean temperature, according to HadCRUT4 data from 1850 to 2013.
About the Author: EARTH CLIMATE
COMMENTS
- The Deplatforming of ClimateState | Earth Climate on How Facebook and YouTube Silence Climate Science
- Eric Rignot: Sea level rise there is a distinct possibility it could go faster | Earth Climate on Geological fingerprint suggests rapid glacier retreat
- Eric Rignot: Sea level rise there is a distinct possibility it could go faster | Earth Climate on Eric Rignot: Observations suggest that ice sheets and glaciers can change faster, sooner and in a stronger way than anticipated
- The risk with the path to a hothouse Earth | Climate State on Climate Tipping Points Existential Threat to Our Life Support Systems
- Robert Schreib on Electricity generation prices may increase by as much as 50% if only based on coal and gas
Support
Paypal DONATE – Your donation goes towards supporting this website, including covering hosting, posting new content, creation of videos, software licenses, or paying invited guest authors. Another way to support Earth Climate is by becoming a Patreon.